T2SSupplyDemand is an indicator used to enter high-probability trades. Get notified in real time by email, text message or your favorite sound when the price is about to enter key zones & when it touches fresh zones. Don't stare at a screen, wait for the right signal in supply and demand zones.
Using Renko/range/tick/volume bars? Optimal Speed analyses the length of time a bar took to form in order to highlight possible congestion areas. Instantly see the slowest bar of the session, slower-than-average bars, crawl bars and the slowest up and down bars of the day. Strategy compatible.
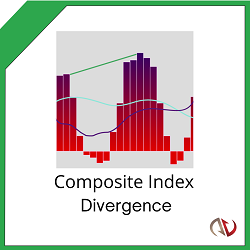
See trend reversals before they happen with intelligent divergence signals! Predict the trend ahead of the crowd with precise entry and exit points. This innovative indicator uses momentum calculations to warn of trend reversals before they happen!
The Diversified Trading System (DTS) brings traders the power of diversification, which can be applied to any trading style. Scalp, swing and trend trade on one instrument or multiple instruments. Only take the very best trade opportunities and ignore the rest. Get started today!
The Min Pack is a starter package featuring IndicatorSmart’s most popular, important and advanced trading tools. This minimum powerhouse tool kit has the most basic, minimum components that show you the minimum of what you cannot see just by looking at an ordinary chart.
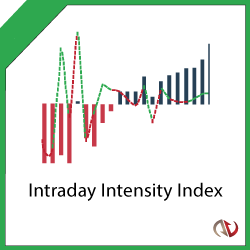
This awesome indicator allows traders to spot institutional block trades (buy and sell). It provides confirmation for impeding trend reversals and avoids premature or false reversal signals. Intraday Intensity Index is recommended by John Bollinger to supplement the Bollinger Bands™ indicator.
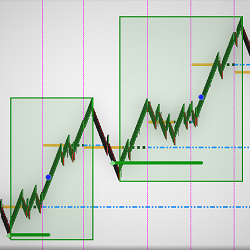
An innovative way to analyze trading opportunities. Contextual trading keeps traders on the right side of the market. Qualified supply/demand zones work in sync with institutional traders. Enter trades with the shift of momentum. Learn and trade. Schedule a free consultation with the coach.
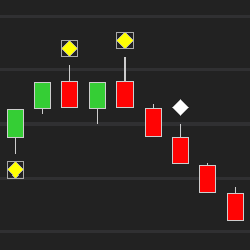
This innovative tool from candlestick guru, Steve Nison, instantly finds his favorite candle patterns on charts. The Nison Candle Scanner works on all asset classes. Traders save hours of research time, spotting candlestick pattern opportunities immediately. Choose a monthly or lifetime purchase!
The VWAP Predator uses VWAP as a zonal guide with Bull and Bear Bands. It then uses logic to recognize accumulation and distribution candles. If those candles cross from a zone to another, then a Signal Candle is produced. Buy Signals in the Bullish Bands and Sell Signals only in the Bearish Bands.
Moore Tech, LLC has over 15 years of experience working with TradeStation, and have converted hundreds of indicators and strategies to be compatible with NinjaTrader. Contact them today to receive a free estimate for having your code converted from EasyLanguage to NinjaScript.
December 2, 2024
Mastering Sideways Markets With Auction Bars and Range Projections
November 19, 2024
Enhancing Your Automated Trading System: Key Insights from Best Pro Trade
November 14, 2024
NinjaTrader New Ecosystem Tools: October 2024 Edition
Enter Email for Updates
 from Indicator Warehouse.png)