Learn how Volume Profile works and use it to track big financial institutions who move and manipulate the markets. Learn my most favorite Volume Profile trading strategies. This book is written in poignant way with many illustrations and real trade examples.
CryptoSignal is a must-have trading signal app for cryptocurrency traders, offering accurate signals for Bitcoin, Ethereum, Dogecoin, Solana, Cardano, and more. Enjoy a 3-day free trial to test its precision. Available on both iOS and Android, CryptoSignal provides timely insights.
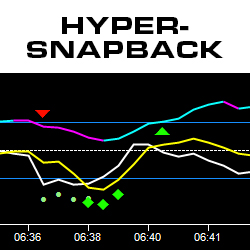
Based on an exclusive algorithm, the HyperSnapback indicator reads anomalies in price that are often difficult to spot in the market. It looks for specific predictive signals and offers trade management guidance. Get the HyperSnapback Indicator now!
Pattern MNTrader is a fully automated trading system. Trading is conducted based on trading patterns, support and resistance lines, Fibonacci lines and trend lines. This unique combination of tools creates an innovative system of support positions with flexible settings.
KingRenko$ is the real “face” of ninZaRenko. It has no artificial open and only real data, so you can see for sure the real OHLC of a KingRenko$ candle. As a result, KingRenko$ can be accurately backtested.
The ELITE Pack includes 44 in-depth Volume Profile training videos, 15 hours of video content and hundreds of real trade examples. Get intraday & swing Volume Profile levels, signals & video! It also includes access to the member forum and custom-built Volume Profile indicators for NinjaTrader 8.
Highly sought after day trading strategy and methods course. Featuring the successful "Ultimate 25Bar, Ultimate Backdoor, and Ultimate Slingshot" systems. Complete with over 65 videos and more. Over 13 years strong. Includes access to our Ultimate Scalper group chat and text support.
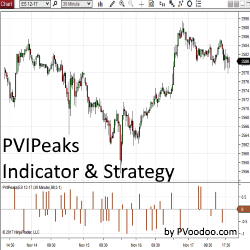
PVIPeaks Indicator and Strategy pinpoints peaks from any standard NinjaTrader indicator and allows traders to use them to generate a signal for an automated strategy. This tool is available exclusively for NinjaTrader 8. Get your free trial today!
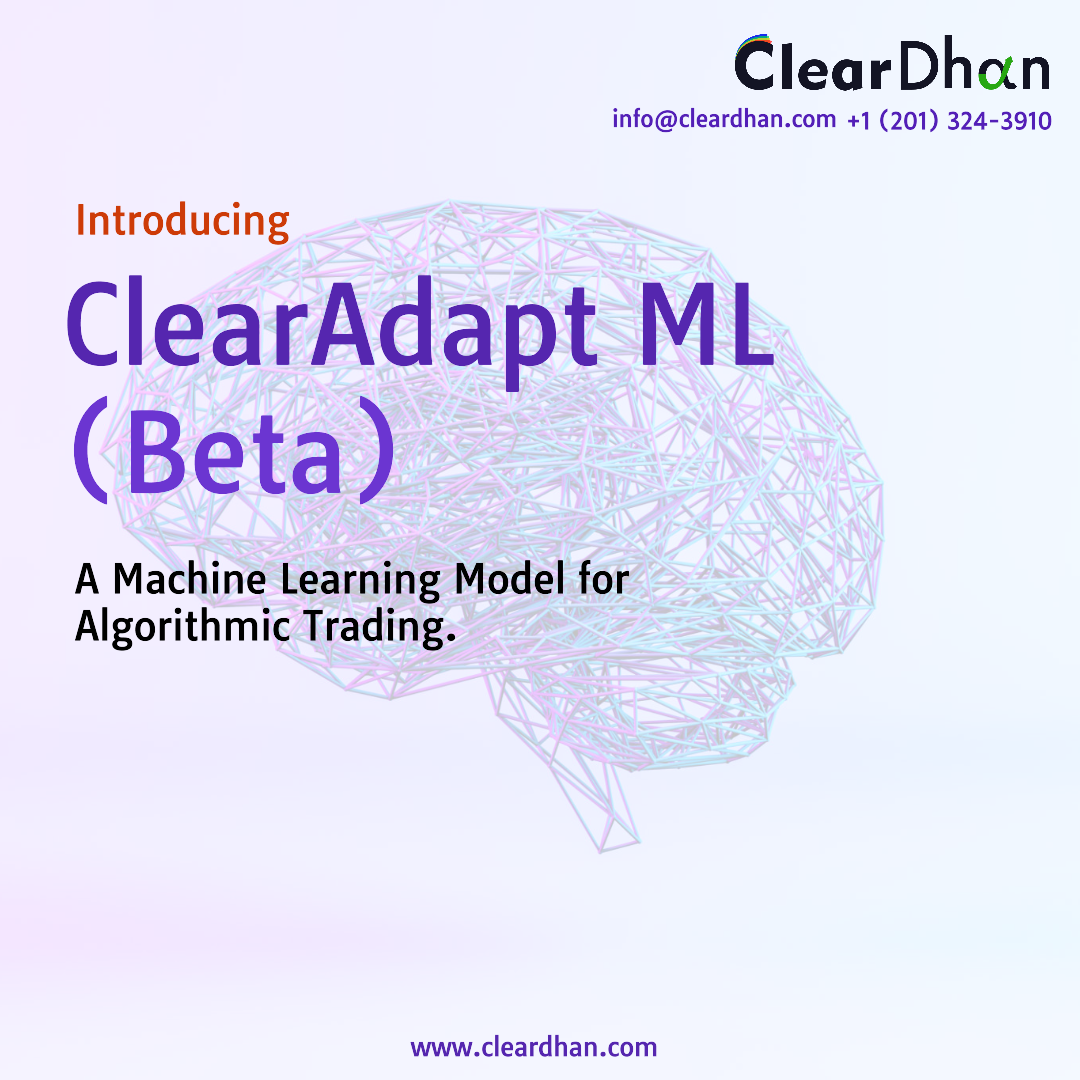
ClearAdapt ML showcases a unique automated deep learning model that fuses an intelligent and seamless system for optimal trade performance. The model works by extracting historical market data and takes on a rule-learning path for pattern recognition and trade entries; minimizing prediction error.
This cutting-edge indicator harnesses the power of Volume, Ranges, and an array of other metrics to pinpoint Key market levels. Brace yourself for a revolutionary approach that goes beyond mere pivot points. This indie is ideal for trading breakouts and reversals. Also efficient at setting PT & SL.
December 2, 2024
Mastering Sideways Markets With Auction Bars and Range Projections
November 19, 2024
Enhancing Your Automated Trading System: Key Insights from Best Pro Trade
November 14, 2024
NinjaTrader New Ecosystem Tools: October 2024 Edition
Enter Email for Updates