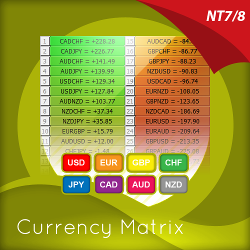
The currency matrix indicator is a simple solution to a complex problem, revealing sentiment for the currency across the currency complex. Now traders can know when they're trading with the universal flow, not against it. Learn more about this unique Forex indicator for NinjaTrader!
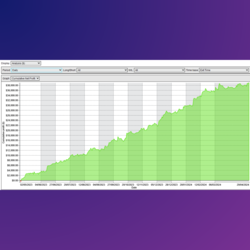
Fully-automated. The VMX selects a time of day to trade during the cash session for stock index futures. This system takes advantage of the volatility created by big institutions moving asset allocations in the equity markets. All positions closed before the end of the cash session.
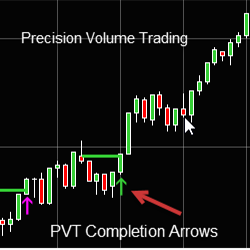
Precision Volume Trading Completions Arrows helps traders determine if the market will move up or down.
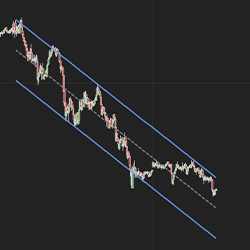
Trend channels are one of the most respected trading strategies used in the markets. However, they can sometimes be tricky to draw, and it's difficult to know if your lines are accurate. Tyche Trading’s unique Price Action Trend Channel Indicator makes it easy! Get a seven-day free trial today!
An ebook that explores my operational strategy in the financial markets, with a focus on technical analysis, operational management and practical techniques. The goal is to gain more awareness and master a style that would otherwise be more complex and require more time.
Do you spend hours reviewing charts and performing repetitive analysis and/or trade management? Why not define your trade setups and let me code them so that you get an alert each time a setup presents itself? Even have them built into an automated strategy.
Scalping: Takes fast and precise trades. Dual-Exit Strategy: Take Profit and Stop Loss. Finds patterns in the data and defines probabilities. Choose the number of contracts. Optimize parameters and adjust your trading style. Works in the NQ and GC futures contracts.
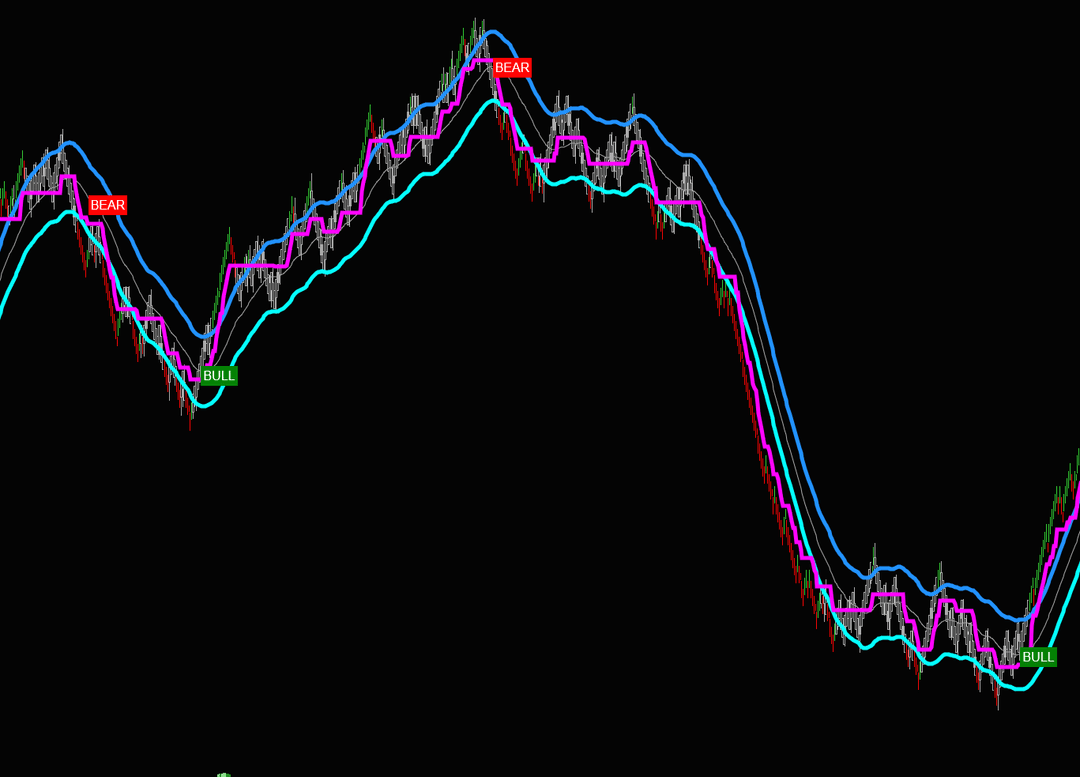
The "Qwave" is a 3-in-1 scalping indicator that includes the Qline trend tracer, Qbands adaptive price bands, and Qwave "BULL/BEAR" price alerts. This indicator is perfect for fast-scalping futures, FX, equities, crypto and includes customizability to optimize for intraday & swing trading, as well.
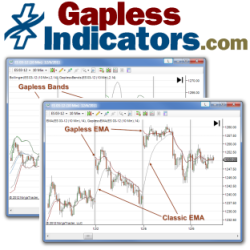
Never worry how an opening price jump or drop affects your favorite classic indicator (MACD, Stochastics, EMA, ATR, etc.). Gapless Indicators are enhanced versions of 15 classic technical indicators that self-adjust in real-time to any opening gap (aka overnight gap).
Performs real-time analysis of the volume and price trends to color the lower panel of the chart with actionable information. When both are trending in the opposite direction, the panel will be colored purple to mark this "unusual behavior." Start using this key Information in your trade plan today!
December 2, 2024
Mastering Sideways Markets With Auction Bars and Range Projections
November 19, 2024
Enhancing Your Automated Trading System: Key Insights from Best Pro Trade
November 14, 2024
NinjaTrader New Ecosystem Tools: October 2024 Edition
Enter Email for Updates