With decades experience as an active trader & accredited coach, Mandi understands what it takes to build a successful trading career. She specializes in coaching HedgeFund, Prop, Bank & Private Traders around the globe in the essential mindset aspects of trading.
The Tradesight Live Trading Lab is a Discord channel that allows anyone to listen to live market commentary, view charts shared by Tradesight analysts, and ask questions throughout the trading day. It is a free service and available to anyone who downloads the Discord app on PC, Mac, web, or mobile.
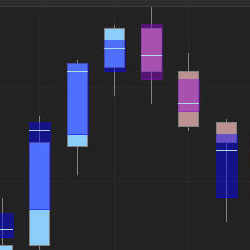
Highlight the Value Area (VA) & Point of Control (POC) of every single candle on your chart, or filter candles with high volume only. The Value Area is colored by the Bid/Ask delta. Get started with a free 7-day trial today!
Build, test & trade automated or discretionary systems in Futures, Forex & Equity markets. Generate concise trade signals while incorporating top day trading indicators. For example, use simple solvers to easily incorporate Fibonacci retracements from leading indicators. Start your free trial now!
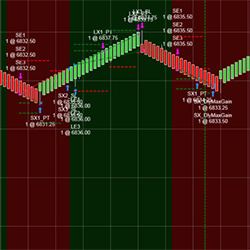
Trading123 AutoTrader is a fully automated trading algorithm that has been programmed to identify the trend. It includes entries, exits, profit targets, trailing stops plus profit & stop loss management. Designed to trade the futures markets, trend reversals and remove human emotion from trading.
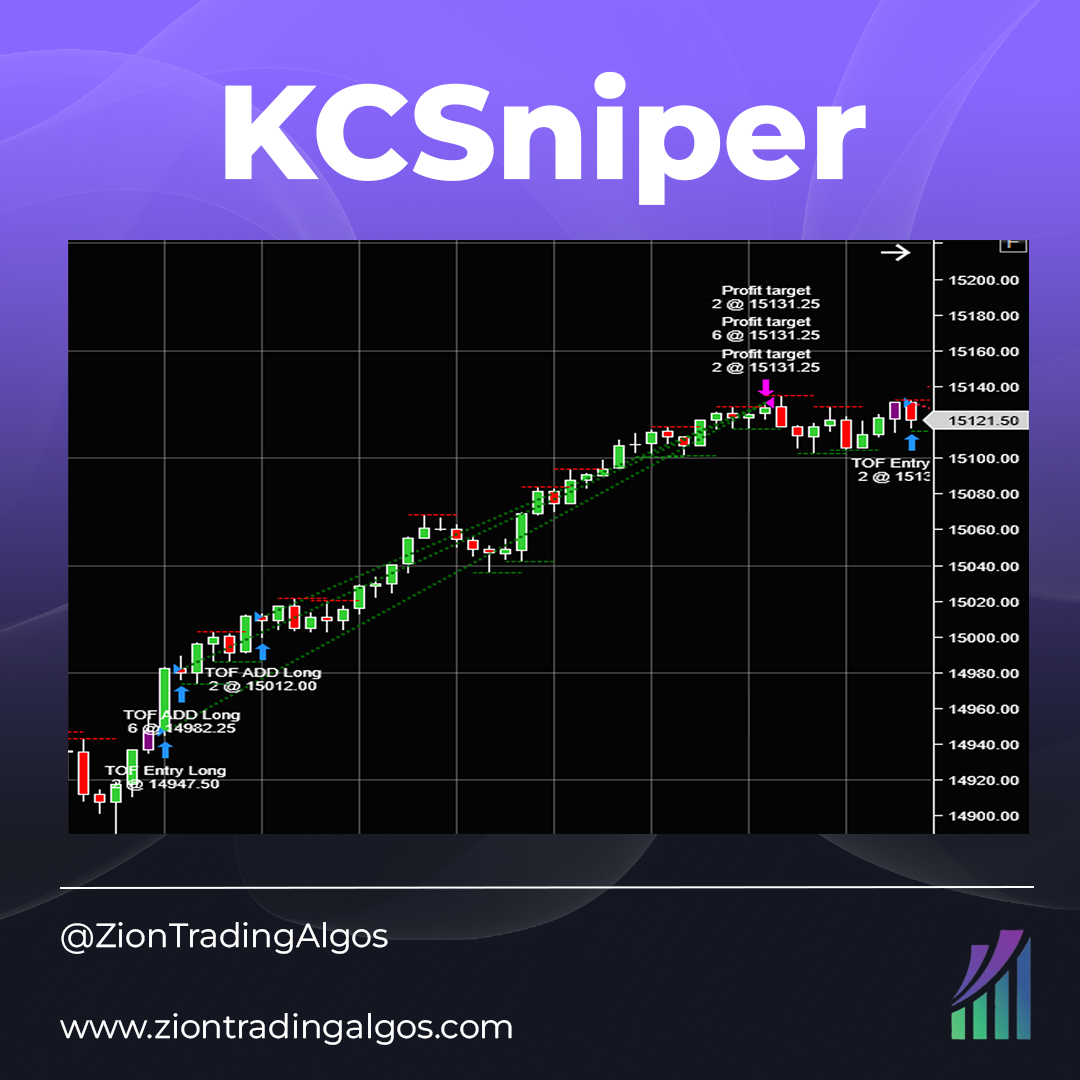
KCSniper is a Keltner Channel-based system on the 10-minute chart. It is long only and does not pyramid into positions, but has a single entry and exit model. It uses volatility based stop loss and take profit targets to remain adaptable. Trades MES and MNQ.
Since 2005, Whitmark Development is a full-time, US-based NinjaScript consultant that offers custom coding services with special expertise in fully-automated strategies, delivering innovative solutions for traders and vendors with full-service support. Call or Email for a project consultation!
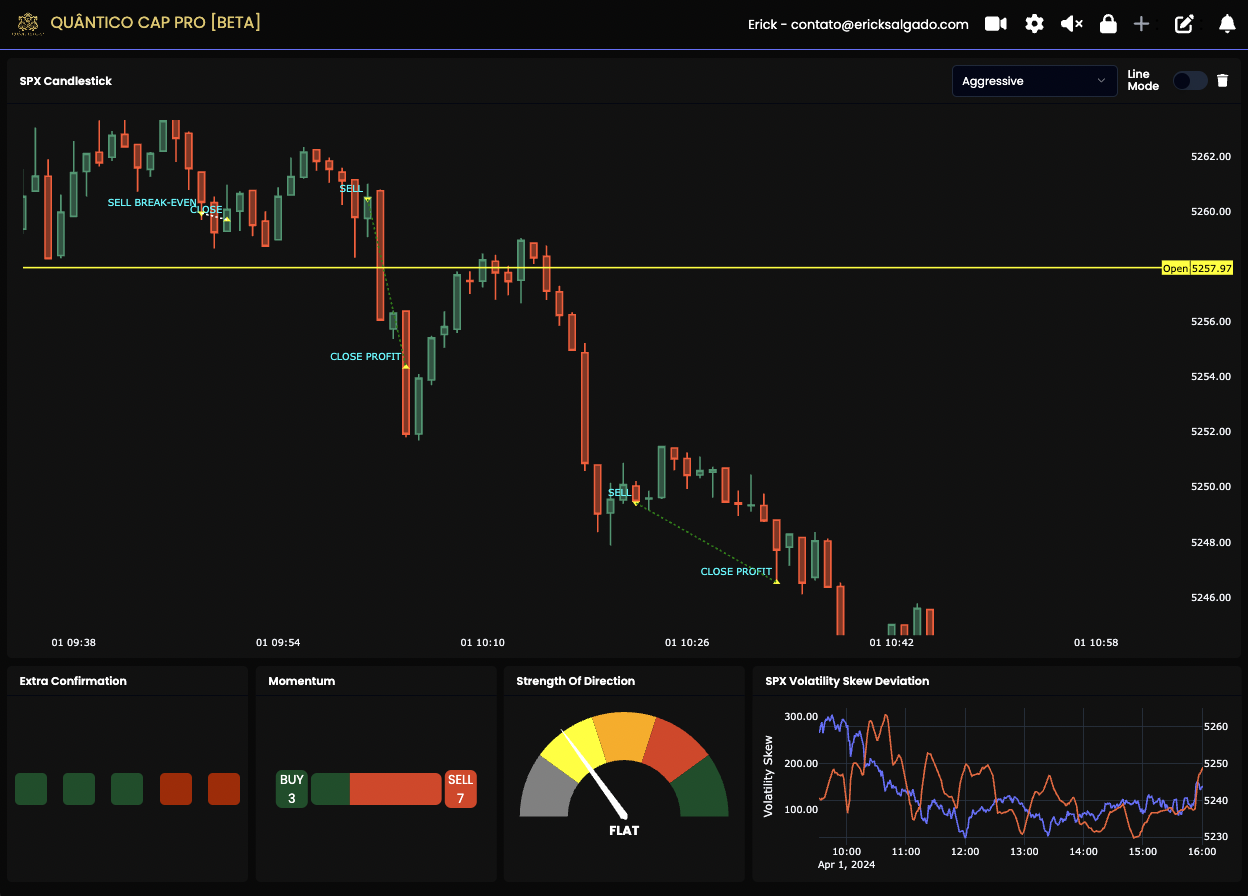
Access clear buy and sell signals tailored for trading precisely when our algorithm detects market maker interventions. Exclusively offered for ES and NQ, seize the opportunity to join our community of hundreds of traders already leveraging 0DTE and Market Maker setups.
Visually add buying and selling pressure analysis and time & sales data to any chart. See the pace of the tape and order flow analytics in an easy to understand tape speed monitor format that allows you to quickly read the tape. The Geiger Counter is an instantaneous indicator of order flow shift.
The versatility of the system extends to both trend and reversal trading strategies, accommodating scalping, day trading, and swing trading. It seamlessly operates on various bar types and timeframes, offering dynamic Support/Resistance lines and intuitive market insights.
December 2, 2024
Mastering Sideways Markets With Auction Bars and Range Projections
November 19, 2024
Enhancing Your Automated Trading System: Key Insights from Best Pro Trade
November 14, 2024
NinjaTrader New Ecosystem Tools: October 2024 Edition
Enter Email for Updates