With no coding required, StratGen allows the everyday trader to generate strategies. In a couple of clicks, traders can generate strategies with over +1,000 signals at their fingertips. Generate strategies using indicators, price action, time of day, alternate exits and much more.
If you can see when price and momentum have diverged, then you can evaluate when and where price may change directions. The SuperD indicator tracks seven different momentum oscillators. You don't even need to have any of the momentum indicators on your chart!
WizBot streamlines your NinjaTrader workflow. Build, test and automate accurate trading strategies without coding. Intuitive indicator combination creates customized systems. Automate execution while retaining discretionary control. Spend more time developing strategies and less on repetitive tasks.
A traditional Gann Fan with upgraded features. Save time with the Speedkey onscreen task command buttons. Derive better leading edge, price action information from your Gann Analysis, including support and resistance identification and real-time price momentum information. Contact for a free trial.
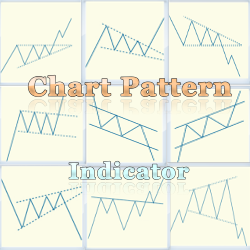
The Chart Pattern Indicator Package includes a number of pattern recognition indicators such as pennant, flag, wedge, triangle and more. The indicators can be purchased separately or discounted as a suite. Learn more!
An in-depth course specifically developed to trade Nasdaq futures using Bookmap.com and take advantage of its unique behavior, the NQ Order Flow course includes 3 hours of deep dive into all order flow patterns and how to exactly trade them, exhaustions, absorptions, spoofs, book flips and more.
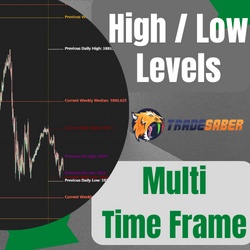
This indicator marks the High/Low median of the previous candle in various time frames. Options include: 1 min, 5 min, 15 min, 30 min, 60 min, 240 min, previous daily, current daily. previous weekly and current weekly.
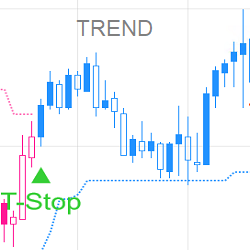
This strategy is a trailing stop indicator turned into a fully automated strategy on "autopilot" that manages trades from open to close. Follow the trend on any time frame of your choice - available as lifetime purchase or monthly lease.
Visually add buying and selling pressure analysis and time & sales data to any chart. See the pace of the tape and order flow analytics in an easy to understand tape speed monitor format that allows you to quickly read the tape. The Geiger Counter is an instantaneous indicator of order flow shift.
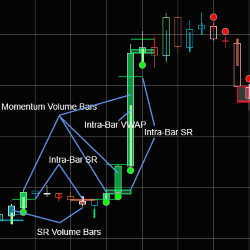
Every bar contains information. You miss a lot of valuable information due to filtering bars by time, variance or some other method. The best solution is to allow these bars to provide you with all the valuable and needed information in a compact and informative manner.
December 2, 2024
Mastering Sideways Markets With Auction Bars and Range Projections
November 19, 2024
Enhancing Your Automated Trading System: Key Insights from Best Pro Trade
November 14, 2024
NinjaTrader New Ecosystem Tools: October 2024 Edition
Enter Email for Updates