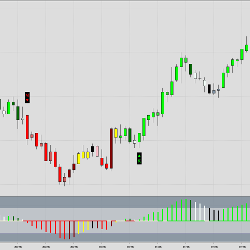
The Zerolag Oscillator is a MACD type momentum oscillator, based on two zerolagging moving averages. The indicator is designed for locating momentum and pullback entries. Momentum entries are found shortly after a trend change, whereas retracement entries focus on the middle chunk of a larger trend.
The Helix strategy is the combination of our Entry Zone indicator and the Trade Management strategy, hence the name Helix (or double Helix). Helix allows you to create your Entry Zones based on your setup rules. Then, after trade execution, Helix will manage the trade based on your rules.
Cutting-edge NinjaTrader 8 Risk Reward Indicator empowers you to make informed decisions with unparalleled precision. Effortless extension, tailored risk levels, adjustable aesthetics, with free 14 days trial and 24/7 support line.
Marmolillo is an automated trading system with a 3-year backtest, designed to trade in NQ, MNQ, ES or MES on the NinjaTrader 8 platform. The system only makes one daily entry and is compatible with manual operation once it has performed its automatic operation.
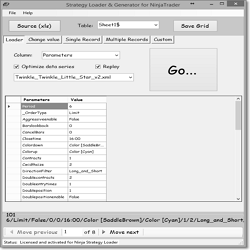
The Ninja Strategy Generator allows traders to make changes to the Parameters record that exports from NinjaTrader to create new strategies with slight variations of the strategy you wish to optimize.
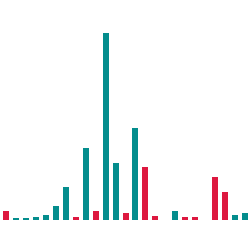
The MPace indicator shows the Velocity (speed) of the tape. It allows users to see the speed at which bids are being hit, and the speed at which offers are being lifted.
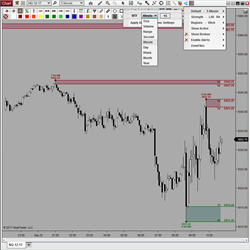
Supply & Demand MTF automatically displays areas of support and resistance. It features 8 unique Zone Types with abilities to show, hide, add, remove, modify, merge, save or load templates with a single click via a unique right click context menu or toolbar icon. Strategy Builder & Bloodhound Ready!
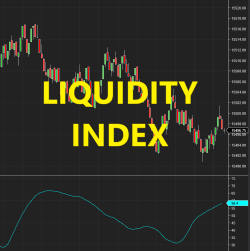
Liquidity is one of the most important signals that traders can pay attention to in the market. It shows how market participants are feeding the price levels. It is not only for limit orders but also related to the speed that traders and institutions can respond to new price actions.
Emet Trading Solutions is a team of experienced programmers focused on coding custom automated trading strategies and indicators. The programmers at Emet Trading Solutions can turn trading ideas into fully automated systems and provide ongoing technical support. Get a free quote for your project!
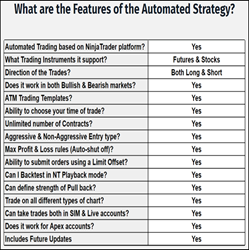
Automated trading tool designed to execute any futures contract based on a combination of predetermined settings and user-defined parameters. It aims to provide high-quality and statistically improved trade entries. One can use these strategies for day trading, and/or scalping intraday price moves.
December 2, 2024
Mastering Sideways Markets With Auction Bars and Range Projections
November 19, 2024
Enhancing Your Automated Trading System: Key Insights from Best Pro Trade
November 14, 2024
NinjaTrader New Ecosystem Tools: October 2024 Edition
Enter Email for Updates