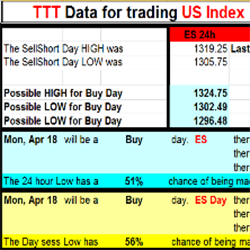
Based on the trading techniques of George Taylor, the TTT E-Book provides the necessary data to trade using the Taylor Trading Technique. After the market close receive 24 hour and daily data to plan your trades for the next trading session. Free 1-week trial available!
A complete trader's toolbox of 8 custom indicators that are designed to give you a competitive edge in any market. Algorithmic components give actionable trade signals, trends and pattern recognition for day, swing, scalping or trend following trading styles in futures, forex and equities.
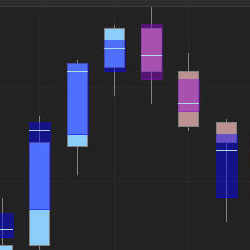
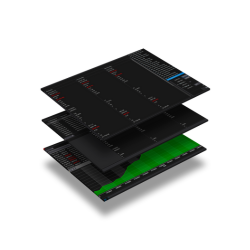
Highlight the Value Area (VA) & Point of Control (POC) of every single candle on your chart, or filter candles with high volume only. The Value Area is colored by the Bid/Ask delta. Get started with a free 7-day trial today!
Mentor one to one what you'll find inside: 8 hours of live lectures, 4 hours of live backtest, community discord lifetime live weekly backtest, weekly live review, live archive, markup price action, lifetime updates on new concepts, private structure indicator.
Learn order flow trading from experienced full-time traders. We meet live multiple times each week - all meetings, clinics and workshops are recorded to our members library and you can interact 24x7 in our Slack group. We’re 100% focused on consistent trade setups and a FURU-free zone!
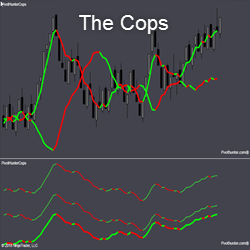
THE COPS includes the duo, Dog and Sheriff, working in close harmony. Dog swings wide when The Convict begins to run. When Dog is narrow, traders wait for the separation before considering a market entry. The COPS in the bottom panel measure momentum at 3 levels.
Every download will receive a 14-day Free Trial of the app on either Android or Iphone. You will be able to test the technology, analysis, trading signals and everything else at no cost. See how Forex Trading Unlocked can enhance your forex and futures trading. Gain trading consistency!
Denotes fitness functions in the NinjaTrader 8 platform, evaluating trading strategies' performance. By leveraging specific parameters, they assist traders in analyzing, comparing and selecting the most effective trading methodologies.
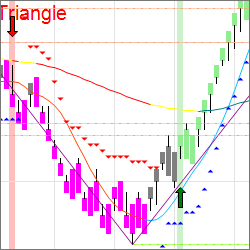
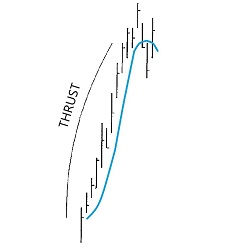
With this tool, traders can now find charts which have potential DiNapoli Directional patterns. Scan multiple markets & time frames in real time for Thrust and other patterns. Use as a chart indicator for easy recognition or as a market analyzer. Video instructions are included - try it today.
The Jurik Volatility Bands can be used for entries for trends by using the zero line crosses whilst counter-trend trades can be made once the oscillator line is close to the outer bands. It works in range-bound and trending markets.
December 2, 2024
Mastering Sideways Markets With Auction Bars and Range Projections
November 19, 2024
Enhancing Your Automated Trading System: Key Insights from Best Pro Trade
November 14, 2024
NinjaTrader New Ecosystem Tools: October 2024 Edition
Enter Email for Updates