If time is important, the Nison Candle Scanner (NCS) experts can install and customize NCS software for traders. NCS White Glove Service is a fast and easy process to remotely configure NCS on any trading computer anywhere in the world. Register now to save time and focus on trading.
The Three Line Strike is a trend-continuation candlestick pattern consisting of four candles. Depending on their heights and collocation, a bullish or a bearish trend continuation can be predicted. The strategy can be combined with volume and price action to identify potential trades.
Get precious info to start your trading week! Focused 100% in E-mini S&P500 Futures and based in a mix of technical analysis with order flow tools, the newsletter presents possible trading scenarios for the week, highlighting important regions. Sign up now for FREE!
Professional-grade, lightning-fast trading system that self-adjusts to the current volatility conditions as it trades the re-emergence of momentum on modern financial markets. Available in standalone and Bloodhound versions. Built rock-solid for NT8.
The Candlestick Express Class is the simple way to learn candlestick patterns and strategies. Traders quickly learn to combine candlesticks, Western technical signals, and trade management strategies. These techniques are useful in Forex or any other market. Get instant access when you register!
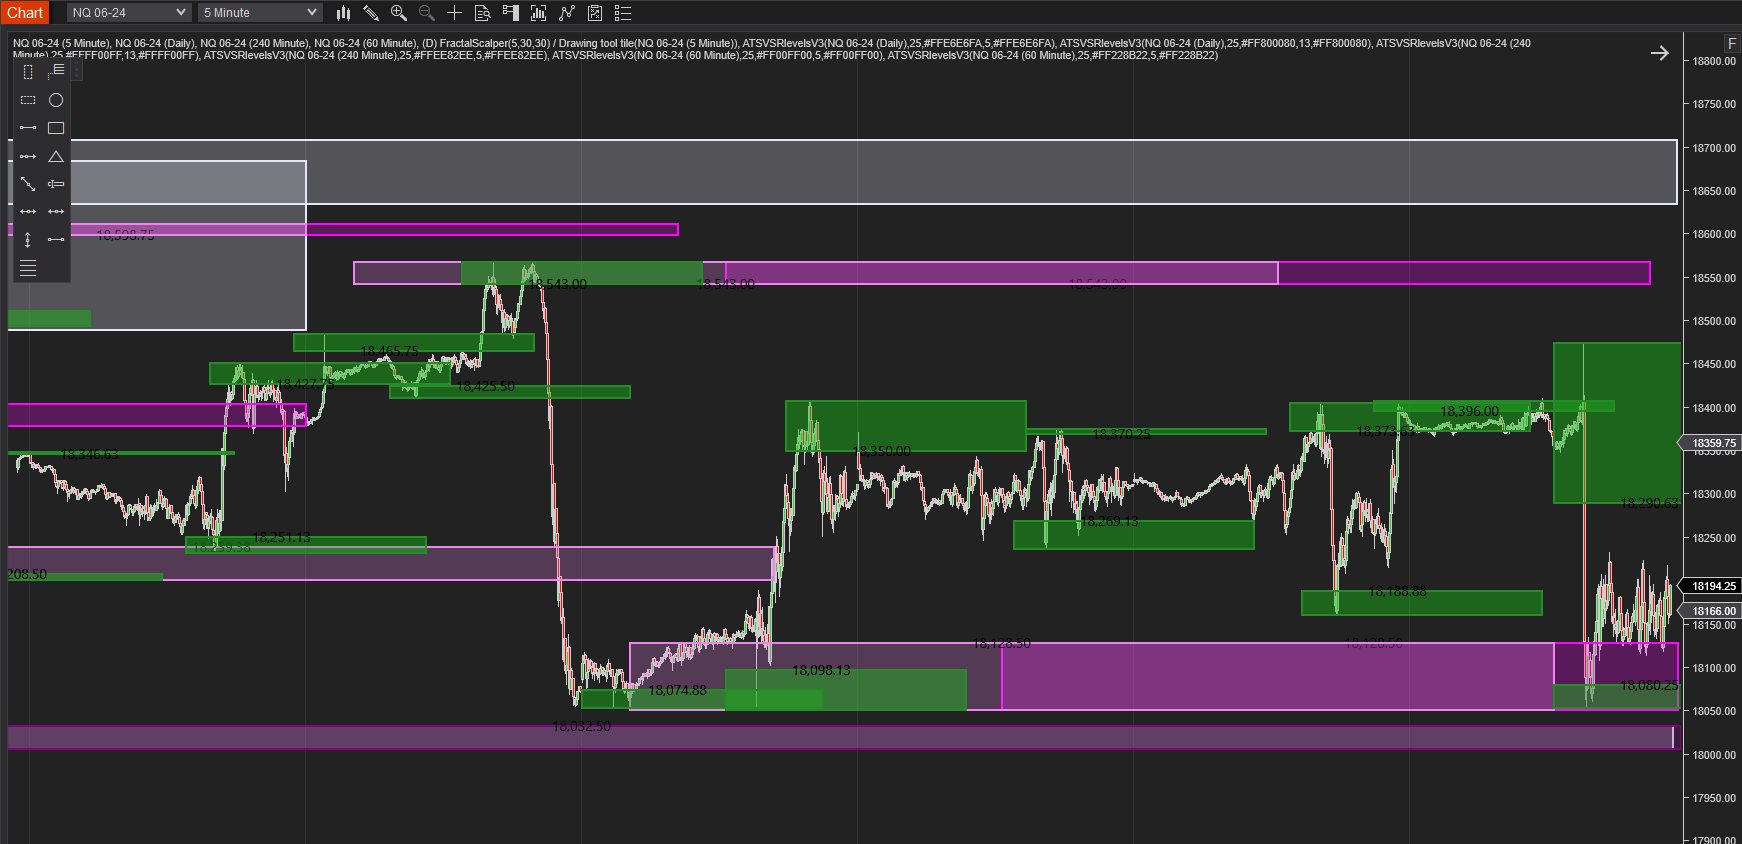
This indicator is designed to provide the trader with better trade locations by plotting visual support and resistance levels at swing points in the market. When multiple data series are used, the ATS VSR Levels can be plotted using the higher timeframe.
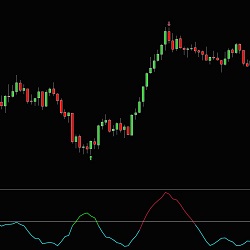
Peaks is a powerful market indicator meticulously designed to identify precise tops and bottoms of price movements. Using sophisticated analysis techniques it pinpoints potential reversal points in the market. Peaks empowers traders to optimize entries & exits, making trading decisions confidently.
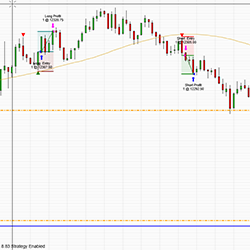
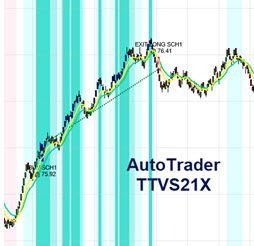
Comprehensive automated system, including 20 strategies, covering a broad range of instruments and market conditions. Includes indicators, color backgrounds and a powerful money management module to protect profit and principal. Lease includes training and support.
PriceIsKing.com's Forex RAM Indicator saves traders time finding entries and eliminates emotional factors. The algorithm is based on years of research and programming. This powerful tool shows entry points when the right condition is met. Get started with a free 2-week trial today!
Take advantage of IndicatorSmart’s special discounts for NinjaTrader Ecosystem users. Be sure to sign up for their Members List on their site for even more special offers and to stay informed about important trader events.
December 2, 2024
Mastering Sideways Markets With Auction Bars and Range Projections
November 19, 2024
Enhancing Your Automated Trading System: Key Insights from Best Pro Trade
November 14, 2024
NinjaTrader New Ecosystem Tools: October 2024 Edition
Enter Email for Updates