Indonesian-speaking. This channel is a place to learn forex, crypto and stock trading using ICT methods. Make daily analysis, design trading plans correctly and measurably.
MTM can trade multiple accounts, instruments (baskets) and orders (grids) simultaneously in one trade. Submit "stealthy" orders. Flexible stop-loss and profit targets. MTM Trendicator for Forex/crypto strength. Time-based trade exits. Monitor news. Save trade profiles for re-use. And much more!
Do you have a trading concept? Let's get it coded right now! Schedule a free consultation today with Yuri, algorithmic trader and full stack developer. NinjaCoding provides solutions for strategies, indicators & extensions to visualizers, database server integrations and third party conversion.
Every download will receive a 14-day Free Trial of the app on either Android or Iphone. You will be able to test the technology, analysis, trading signals and everything else at no cost. See how Forex Trading Unlocked can enhance your forex and futures trading. Gain trading consistency!
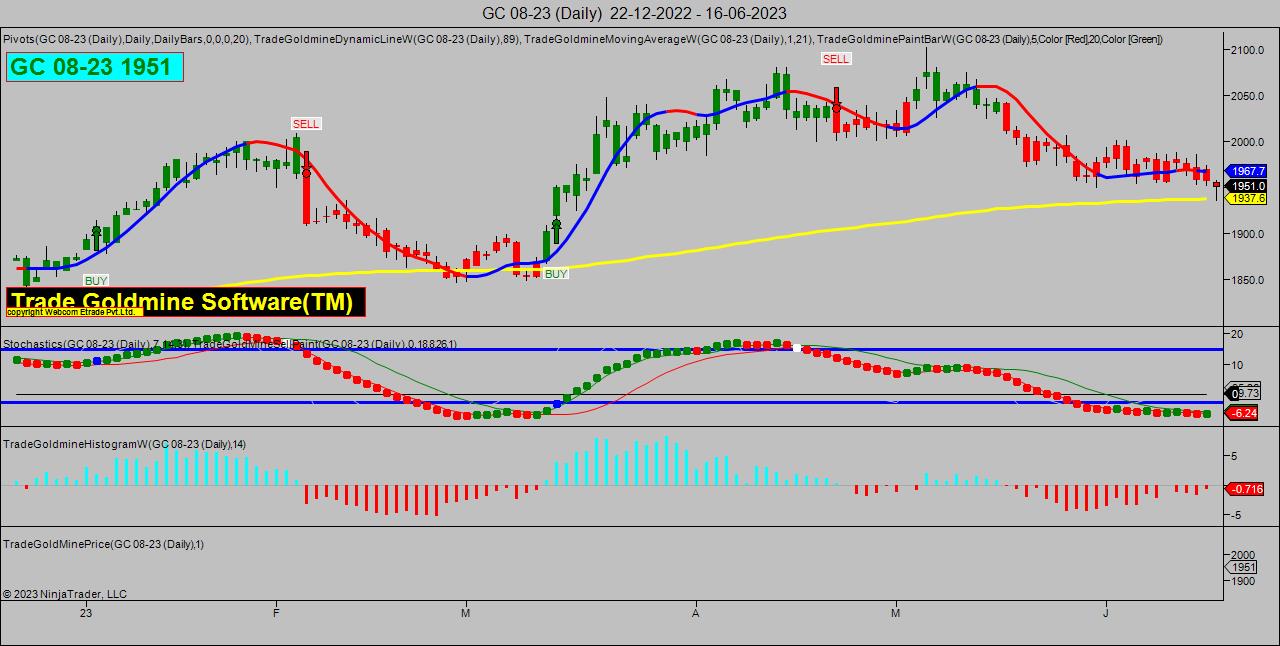
GOLDMINE NINJA TECHNIQUE software is a technical analysis tool that gives user-friendly BUY-SELL signals to traders and helps find perfect resistance & support levels in order to trade more effectively.
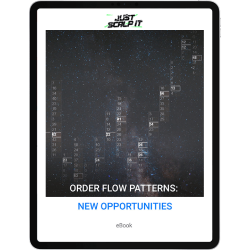
Unlock the secrets of successful trading with the latest version of the Order Flow Trading Setups eBook. Dive into over 12 unique order flow setups, each detailed with examples and entry points. This guide offers practical setups used in daily trading and clear screenshots for each pattern.
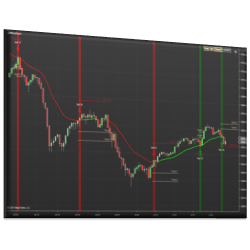
This indicator plots signals, targets, and stops based on support and resistance from various moving average types. The trend is established based on a minimum number of bars above or below the moving average. The signal is initiated on the first touch of the moving average.
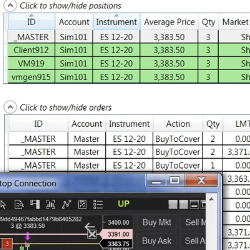
Replicate orders and manage positions from a master NinjaTrader instance to one or multiple NinjaTrader slaves.
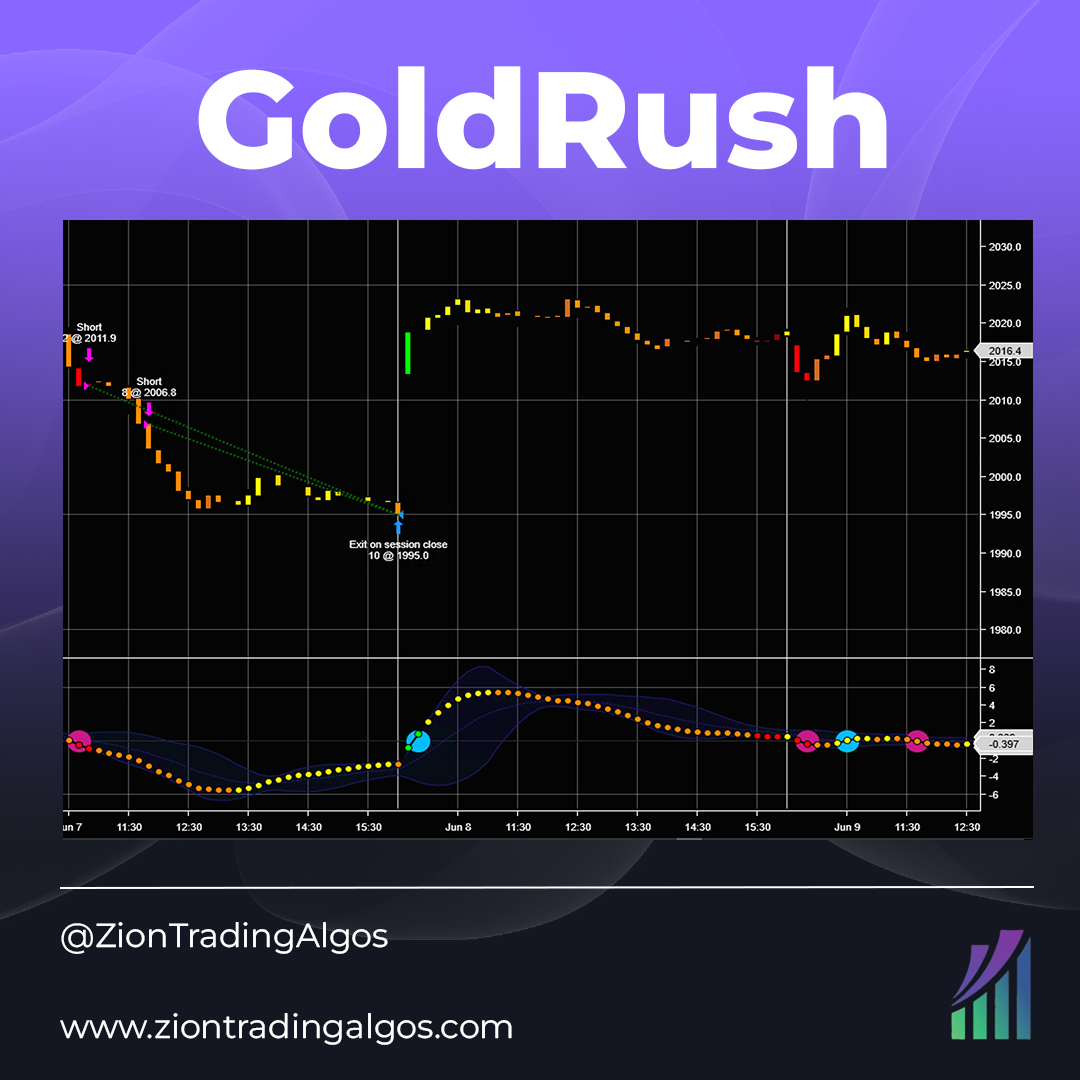
GoldRush is an intraday strategy on the 10-minute chart. Designed to take an initial amount of GC contracts, it uses a few custom indicators that will also be included with purchase.
The STMA indicator offers traders the ability to auto plot higher timeframe Simple or Exponential Moving Average’s on smaller time framed charts. Learn More about the STMA!
December 2, 2024
Mastering Sideways Markets With Auction Bars and Range Projections
November 19, 2024
Enhancing Your Automated Trading System: Key Insights from Best Pro Trade
November 14, 2024
NinjaTrader New Ecosystem Tools: October 2024 Edition
Enter Email for Updates