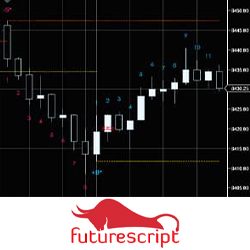
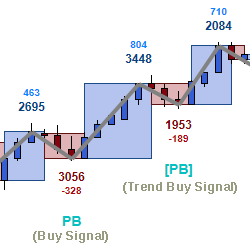
The Price Hacker introduces techniques outlined in the manual to promote the creativity of the user. The hacker section is for identifying sudden shifts in supply and demand, the staircase is used to pinpoint a break in a trend, and the sequence section evaluates the changing of the trends.
Learn how Volume Profile works and use it to track big financial institutions who move and manipulate the markets. Learn my most favorite Volume Profile trading strategies. This book is written in poignant way with many illustrations and real trade examples.
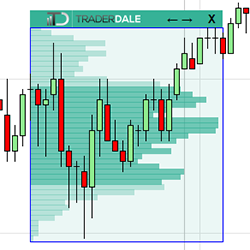
TD’s Flexible Volume Profile helps to reveal institutional trading activity and identifies the strongest support and resistance zones. The use of tick volume data makes it extremely precise leading to potential entries. It is easy to learn, simple to use, and extremely intuitive.
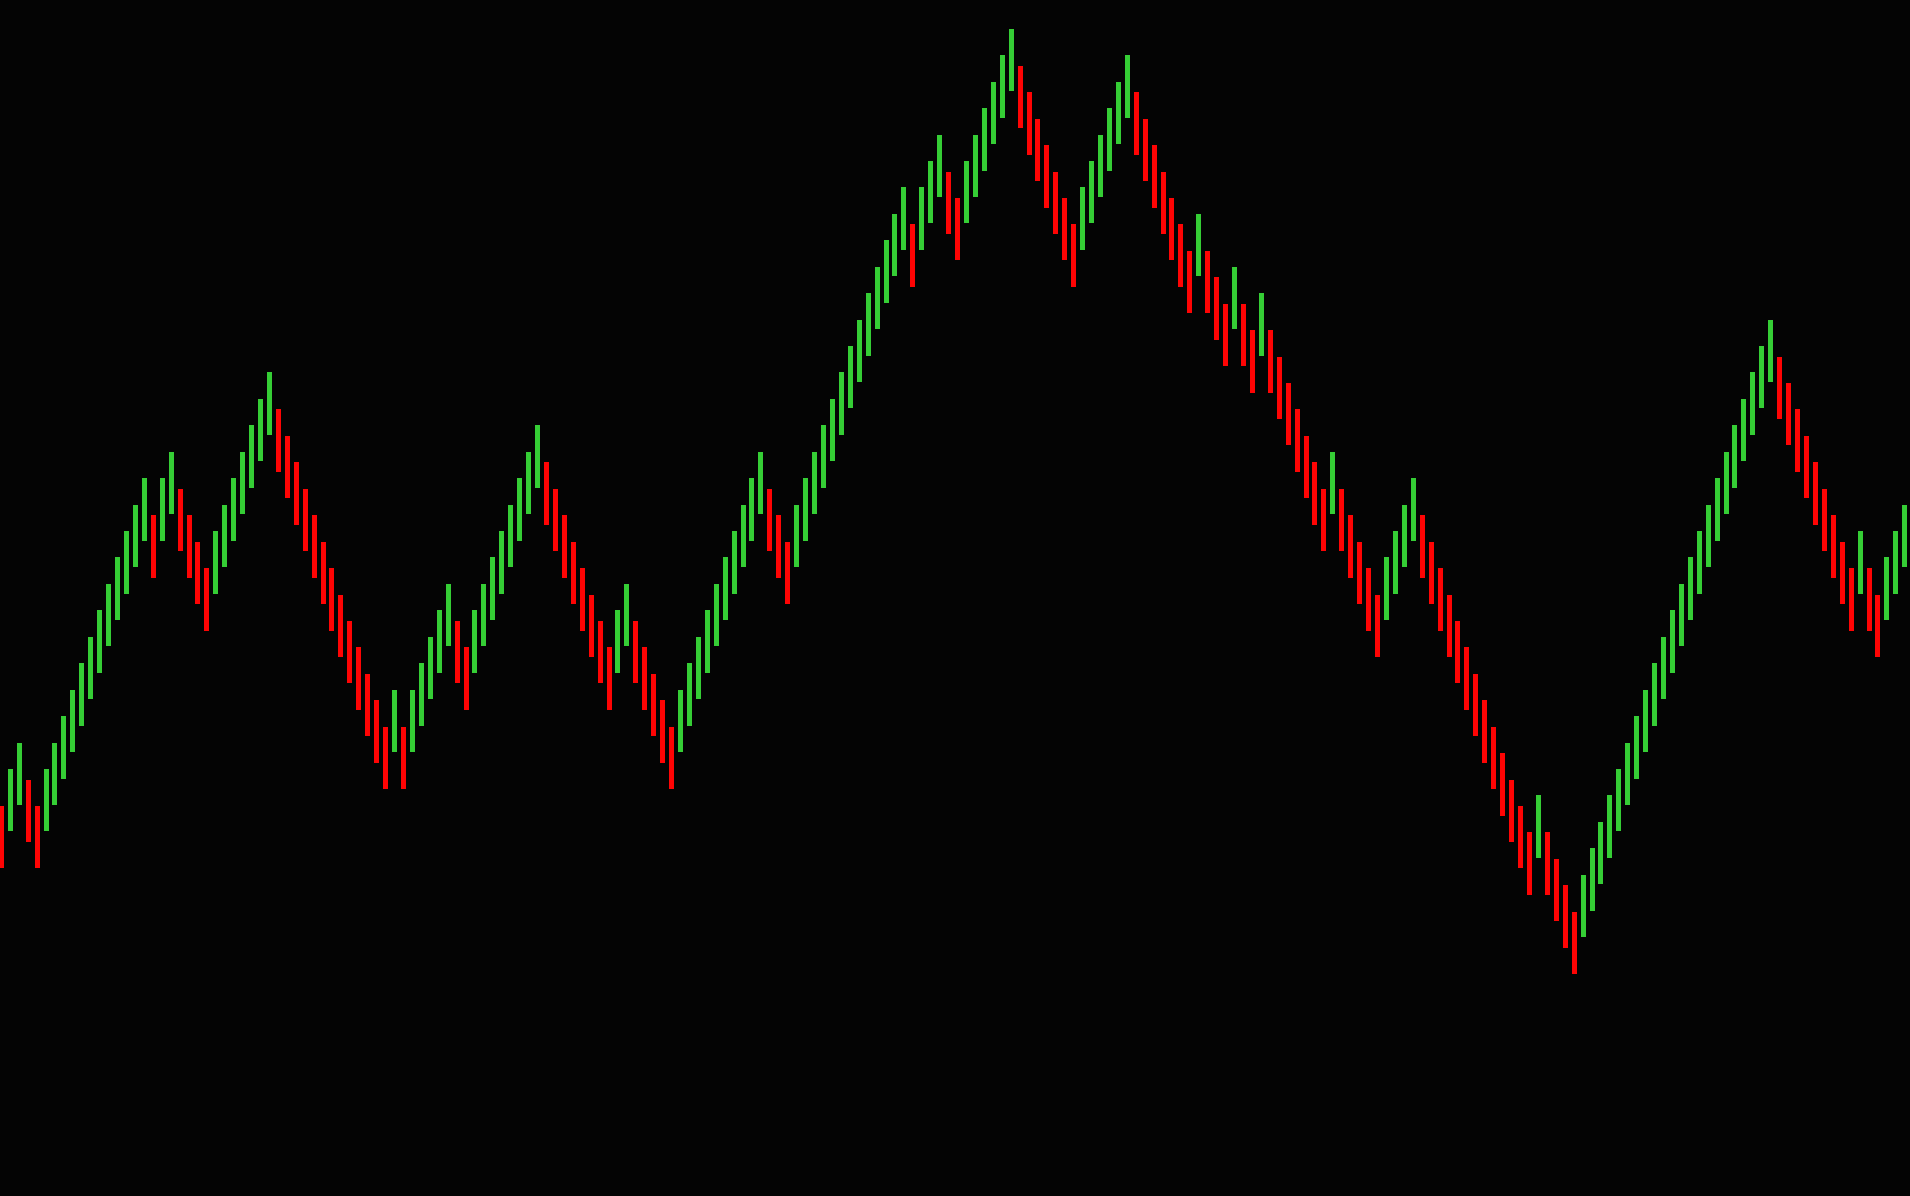
The "Qrenko" is their custom renko brick. This indicator helps traders see trending price action more clearly by smoothing out traditional candlesticks into "Qrenko" bricks. Traders can adjust the shift, offset, and range of the brick settings to suit their specific trading style.
The MCumulativeDelta Indicator shows the bid / ask volume displayed in a histogram over a period. It serves to determine whether supply or demand is dominating and in control and the buying / selling pressure.
RTMC MNTrader is a fully automated trading system. Trading is based on Renko strategy using an exponential moving average. Filtering system based on the MACD and TMA Slope indicators. It has an improved position support system with flexible settings that will improve trading consistency.
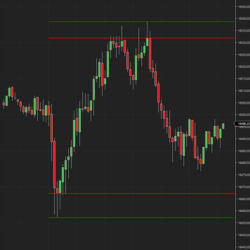
Elevate your trading strategy with the DR/iDR Indicator for NinjaTrader: Your essential tool for identifying key price levels. This advanced indicator displays both the Daily Range and the Implied Daily Range directly on your trading charts, providing crucial insights.
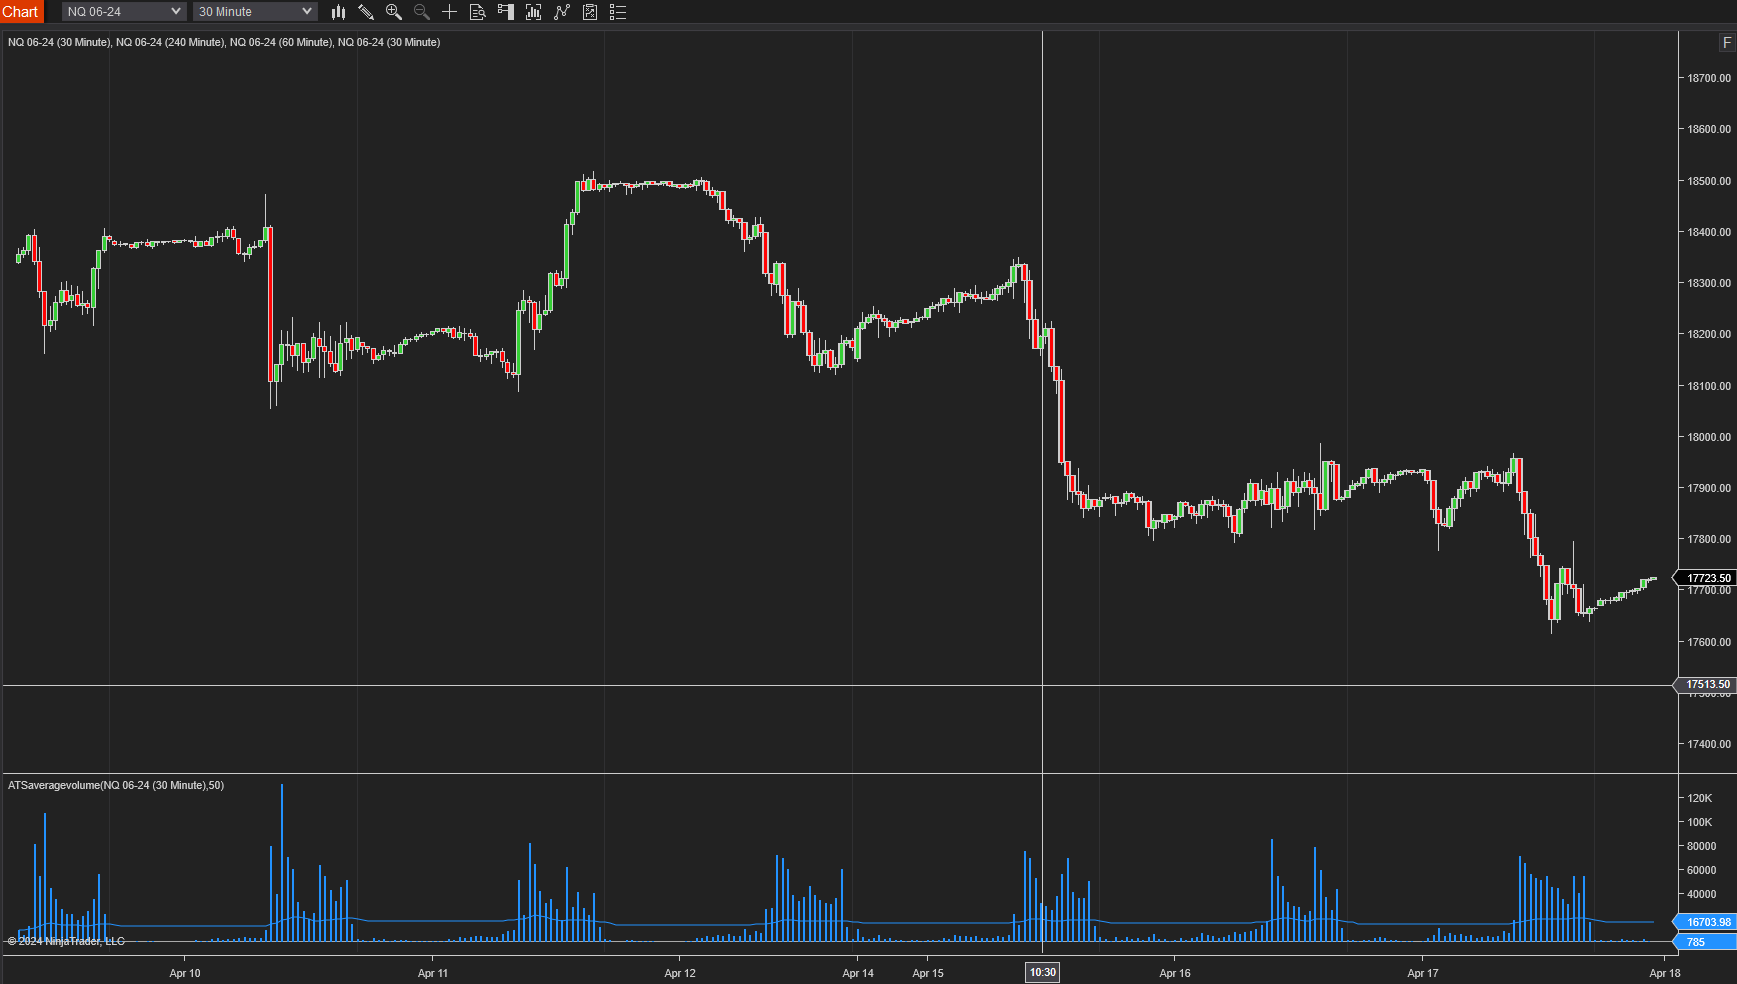
This indicator plots a 50-bar average of the volume overlaid on the current volume. You can change the number of bars used to calculate the average.
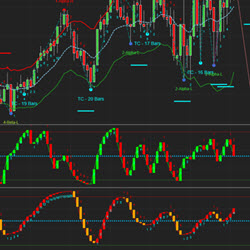
Automatic Cycle Bands, GANN Fan and Fibonacci plotting. Improved double smooth Stochastics, double smooth averages indicators – trend analysis / reversals, 3 volume delta indicators. True average price.
TradePowerFusion is the must-have add-on for all traders using NinjaTrader. This powerful utility allows you to copy your trading accounts & prop firm accounts with all the advanced features of the competition, while offering innovative risk management tools. Experience a different trading approach.
December 2, 2024
Mastering Sideways Markets With Auction Bars and Range Projections
November 19, 2024
Enhancing Your Automated Trading System: Key Insights from Best Pro Trade
November 14, 2024
NinjaTrader New Ecosystem Tools: October 2024 Edition
Enter Email for Updates