Are you tired of only being able to trade futures manually? We have a fully Otter-mated strategy, so you can make trades while you sleep or do the things you enjoy! Try it now with our special introductory period for your first three months.
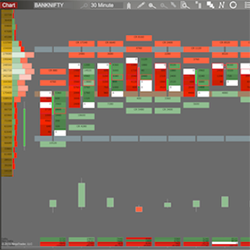
The Bell Order Flow-PRO is a toolkit of optimized order flow and volume visualization. It offers some of the unique features like BidxAsk Ladders, High Volume Alert, Volume Imbalance, Volume Spread Analysis, Delta Candles, Volume Profile, COT, Contract Reversal and customizable chart colors.
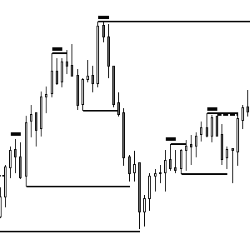
This indicator shows Double Bottoms and Double Tops which are tested by subsequent price action. It shows micro Double Bottoms & micro Double Tops as well. Use it as a discretionary indicator and for automated trading (e.g. BloodHound). Get started with a free 20-day trial today!
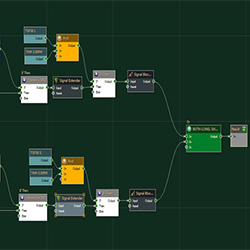
Custom strategy design in BloodHound. Remek! will program your trading strategy as per your specifications and requirements. Learn more!
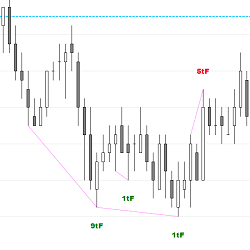
This indicator is a new approach to Price Action trading. It shows Tick Failure Breakouts above swing highs and below swing lows, which can act as support/resistance. Use the Tick Failure Breakout indicator as a discretionary indicator in your Day Trading. Get Started with a free 2-week trial today!
This trading masterclass delivers all the fundamental knowledge and trading skills as the foundations on which to develop your trading career for financial, commodity and digital asset classes. Up to one year to complete. Includes a free trading challenge to qualify for a funded trading account.
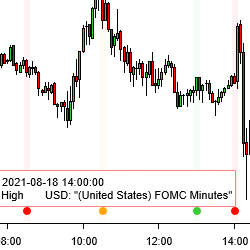
Improve planning of your trades by seeing when economic calendar news gets released – right on your NinjaTrader 8 charts. Option to select either Forex Factory or Myfxbook as news source. You can see news for the current week and historical news releases. You can also filter by news impact and more!
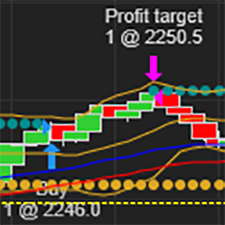
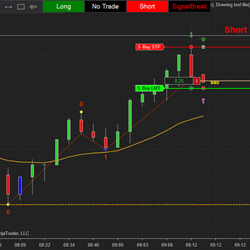
Trade two-legged pullback with this Second Entry Indicator! This is a semi-automated, two-legged pullback strategy using the built-in trading-buttons. Get alerts and your orders are placed automatically at the correct spot (no more dragging orders).
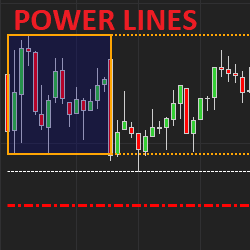
The itcPowerLines indicator displays important intraday support/resistance levels for stock traders (Opening range, morning H/L, yesterday H/L, Weekly H/L, daily SMA/EMA). Colors, styles & width are customizable. Users can also define which elements to display including levels for past days.
Larry Cheung’s investment community provides investment research regarding U.S and Chinese macroeconomics and company-specific fundamental analysis. He also uses technical analysis and order flow to best understand risk/reward for entries and exits across different timeframes.
March 25, 2024
Trading Pullbacks and Reversals: Simplifying a Once Complex Retail Trading Strategy
March 21, 2024
VWAP Indicator: Average Price Shown Based on Price, Volume
March 18, 2024
Trade Copier Strategies: Make Efficiency Work for You When Futures Trading
Enter Email for Updates