With a potential of 1 trade per day, this system is automated from start to finish & designed to be monitored in some capacity. If you can remotely access a computer with the right software, then you can monitor these automated trades from the golf course (with a strong cell signal).
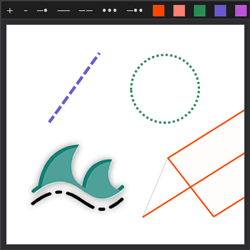
This indicator allows the user to change the color, stroke style and stroke size of drawn objects on the fly without having to dig through various menus. This increases application functionality and user charting efficiency.
You can draw the risk/reward roulette tool at any point on a candlestick chart simply by clicking on the chart with the middle mouse button. This indicator allows you to speed up the drawing of the risk/reward tool on the chart by times, expanding on the functions of the trading platform.
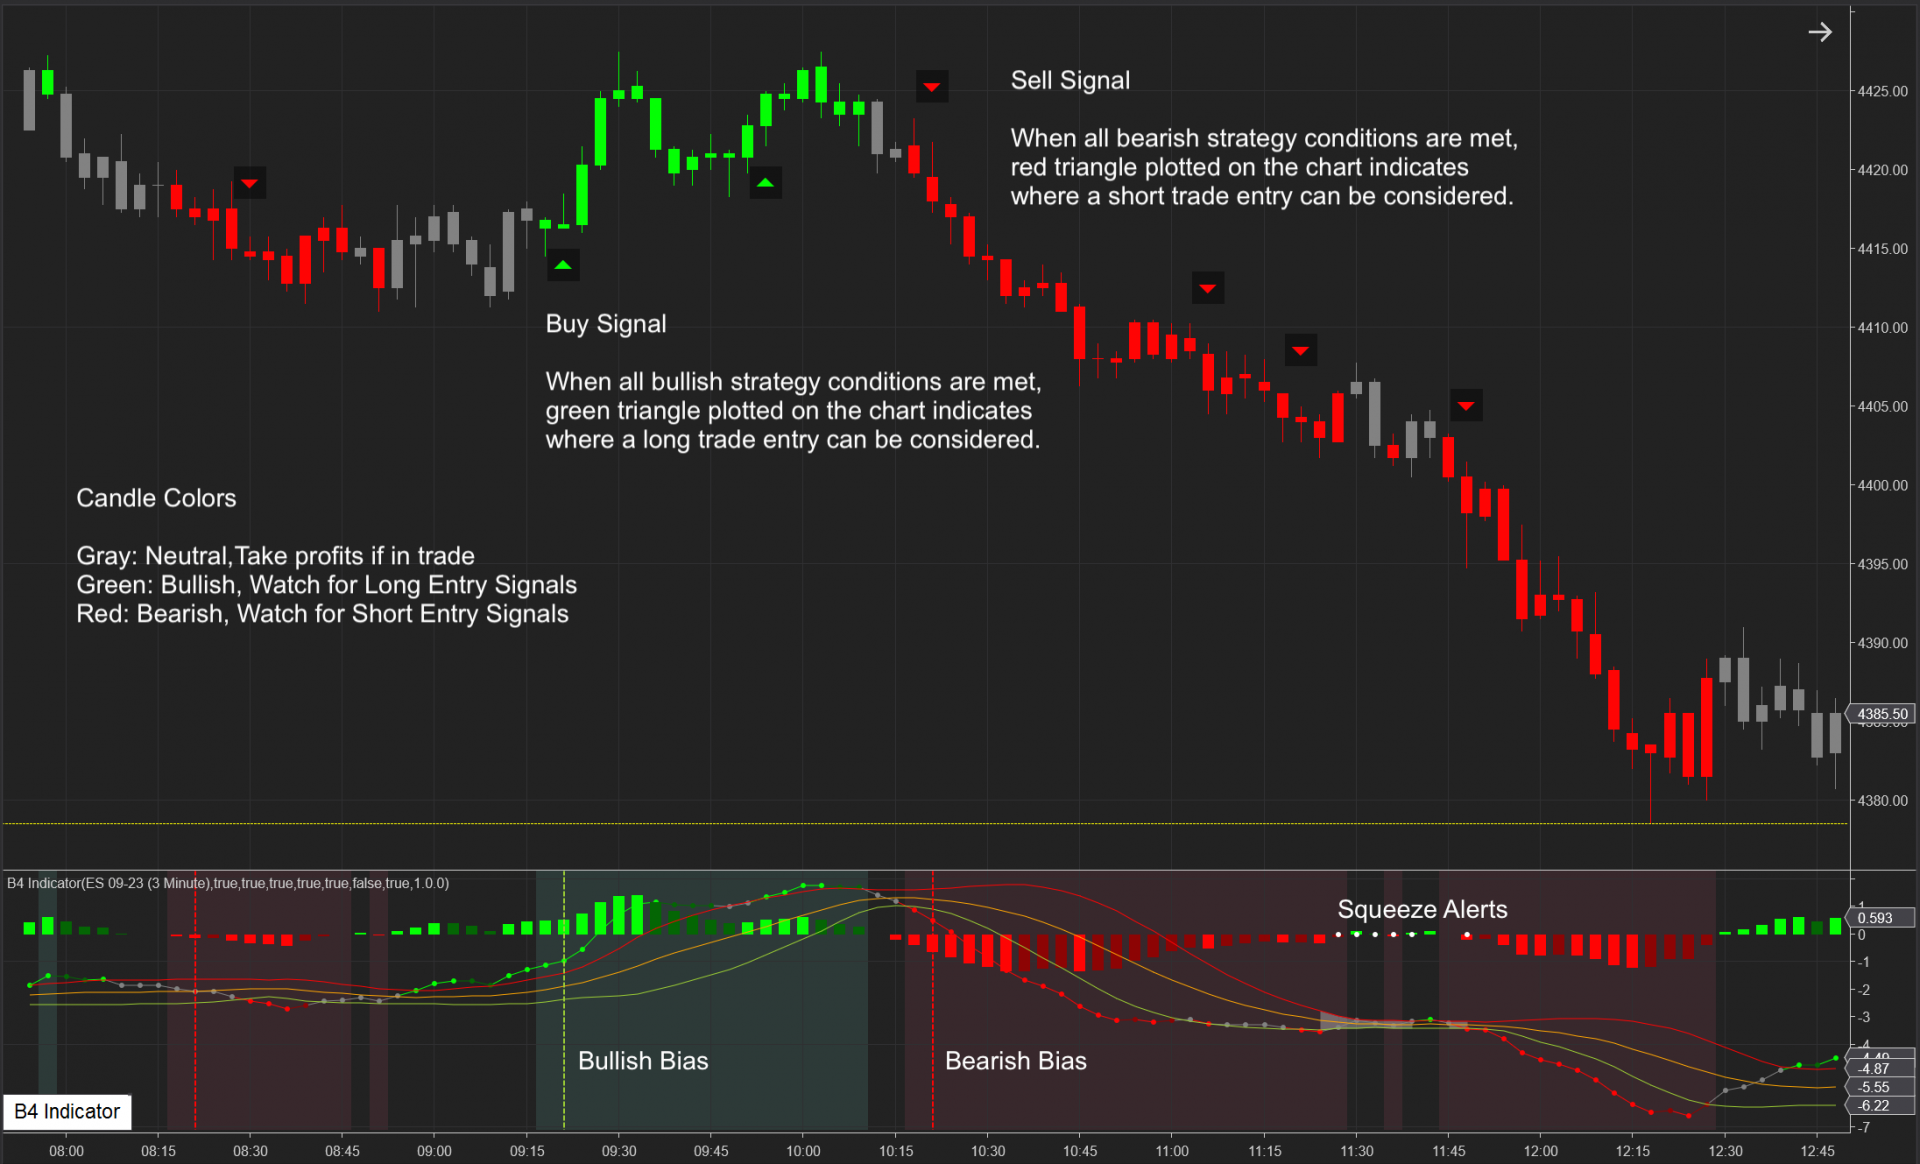
B4 Indicator is a trend and momentum indicator with buy and sell signals. Indicator background color shows the trend bias. Vertical lines show the trend confirmation. When all conditions are met, buy and sell signals are plotted on the chart. It also includes capabilities to detect market squeezes.
ClearAdapt ML showcases a unique automated deep learning model that fuses an intelligent and seamless system for optimal trade performance. The model works by extracting historical market data and takes on a rule-learning path for pattern recognition and trade entries; minimizing prediction error.
Simplify trading screens, and be the first to spot the trend. HeatMap is a tool that informs you when futures, forex or equities markets are all correlated in the same direction, or mixed. Know at a glance when follow through is high, or when the markets are sideways. Get the HeatMap now!
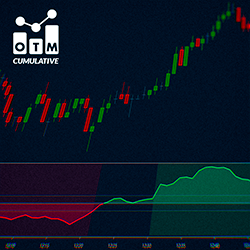
OTM Delta Cumulative is a histogram displaying delta behavior, measuring buying or selling strength. It helps identify trend transitions and clear trends. The curve direction shows the pressure difference between buyers and sellers, aiding informed market decisions.
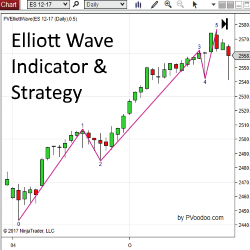
PVElliottWave Indicator is an Elliott Wave indicator designed for the NinjaTrader platform. Get started with a free trial of this indicator now!
Helping people to see beyond the price action – to see how market participant and their effort on the candlestick. Market participant like market buyers and sellers, and their effect on limit buyers and sellers by combining foot print chart and market profile.
December 2, 2024
Mastering Sideways Markets With Auction Bars and Range Projections
November 19, 2024
Enhancing Your Automated Trading System: Key Insights from Best Pro Trade
November 14, 2024
NinjaTrader New Ecosystem Tools: October 2024 Edition
Enter Email for Updates