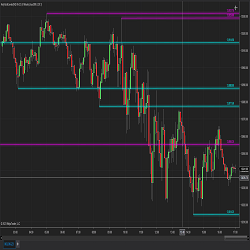
This algorithm calculates the support and resistance based on a look back period (number) of candles or bars and determines the support and resistance levels dynamically.
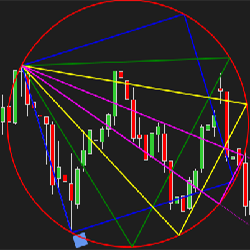
We are pleased to bring NinjaTrader users this tool typically reserved for expensive institutional platforms. The Gann Emblem is a drawing tool for those familiar with its applications, especially traders of the Gartley method.
Speeding Trading Servers offers high performance co-located virtual & dedicated servers (VPS) for professional & retail traders. Optimize fills, reduce slippage & run automated trading strategies 24/7 from any location. Sign up for a free one week trial today!
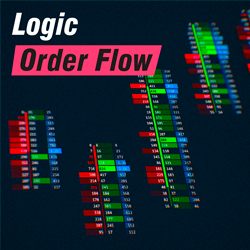
Logic order flow features unique and easy-to-use graphical options, one-click presets and configurations, a profile, footer, and databox for a complete market analysis. It guarantees the best visualization of patterns and zones, making this tool one of the best options on the market.
Traderistic helps to get rid of fear in trading by looking for signs of fear that can impact a trader’s performance. This tool live-monitors the biggest muscle in the body, the heart. Traders can develop a new level of awareness to increase control and serenity, making trading an enjoyable exercise.
Want to scan for any candlestick pattern, on any timeframe, across any list of symbols? Whether you're interested in the most common or advanced patterns, the Candlestick X-Ray™ detects over 90 unique candlestick patterns, making it a highly flexible and powerful candlestick pattern tool.
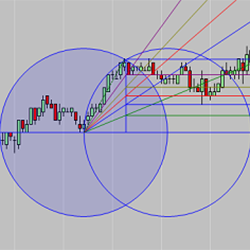
Attention Fibonacci, support/resistance, Gann & market structure enthusiasts! The HarmonicFan draws an A-B line & 2 intersecting arcs are calculated. The upper or lower half of the resulting Vesica Piscis formation is then divided into Fib levels & trend lines are then created as a fan. Learn More!
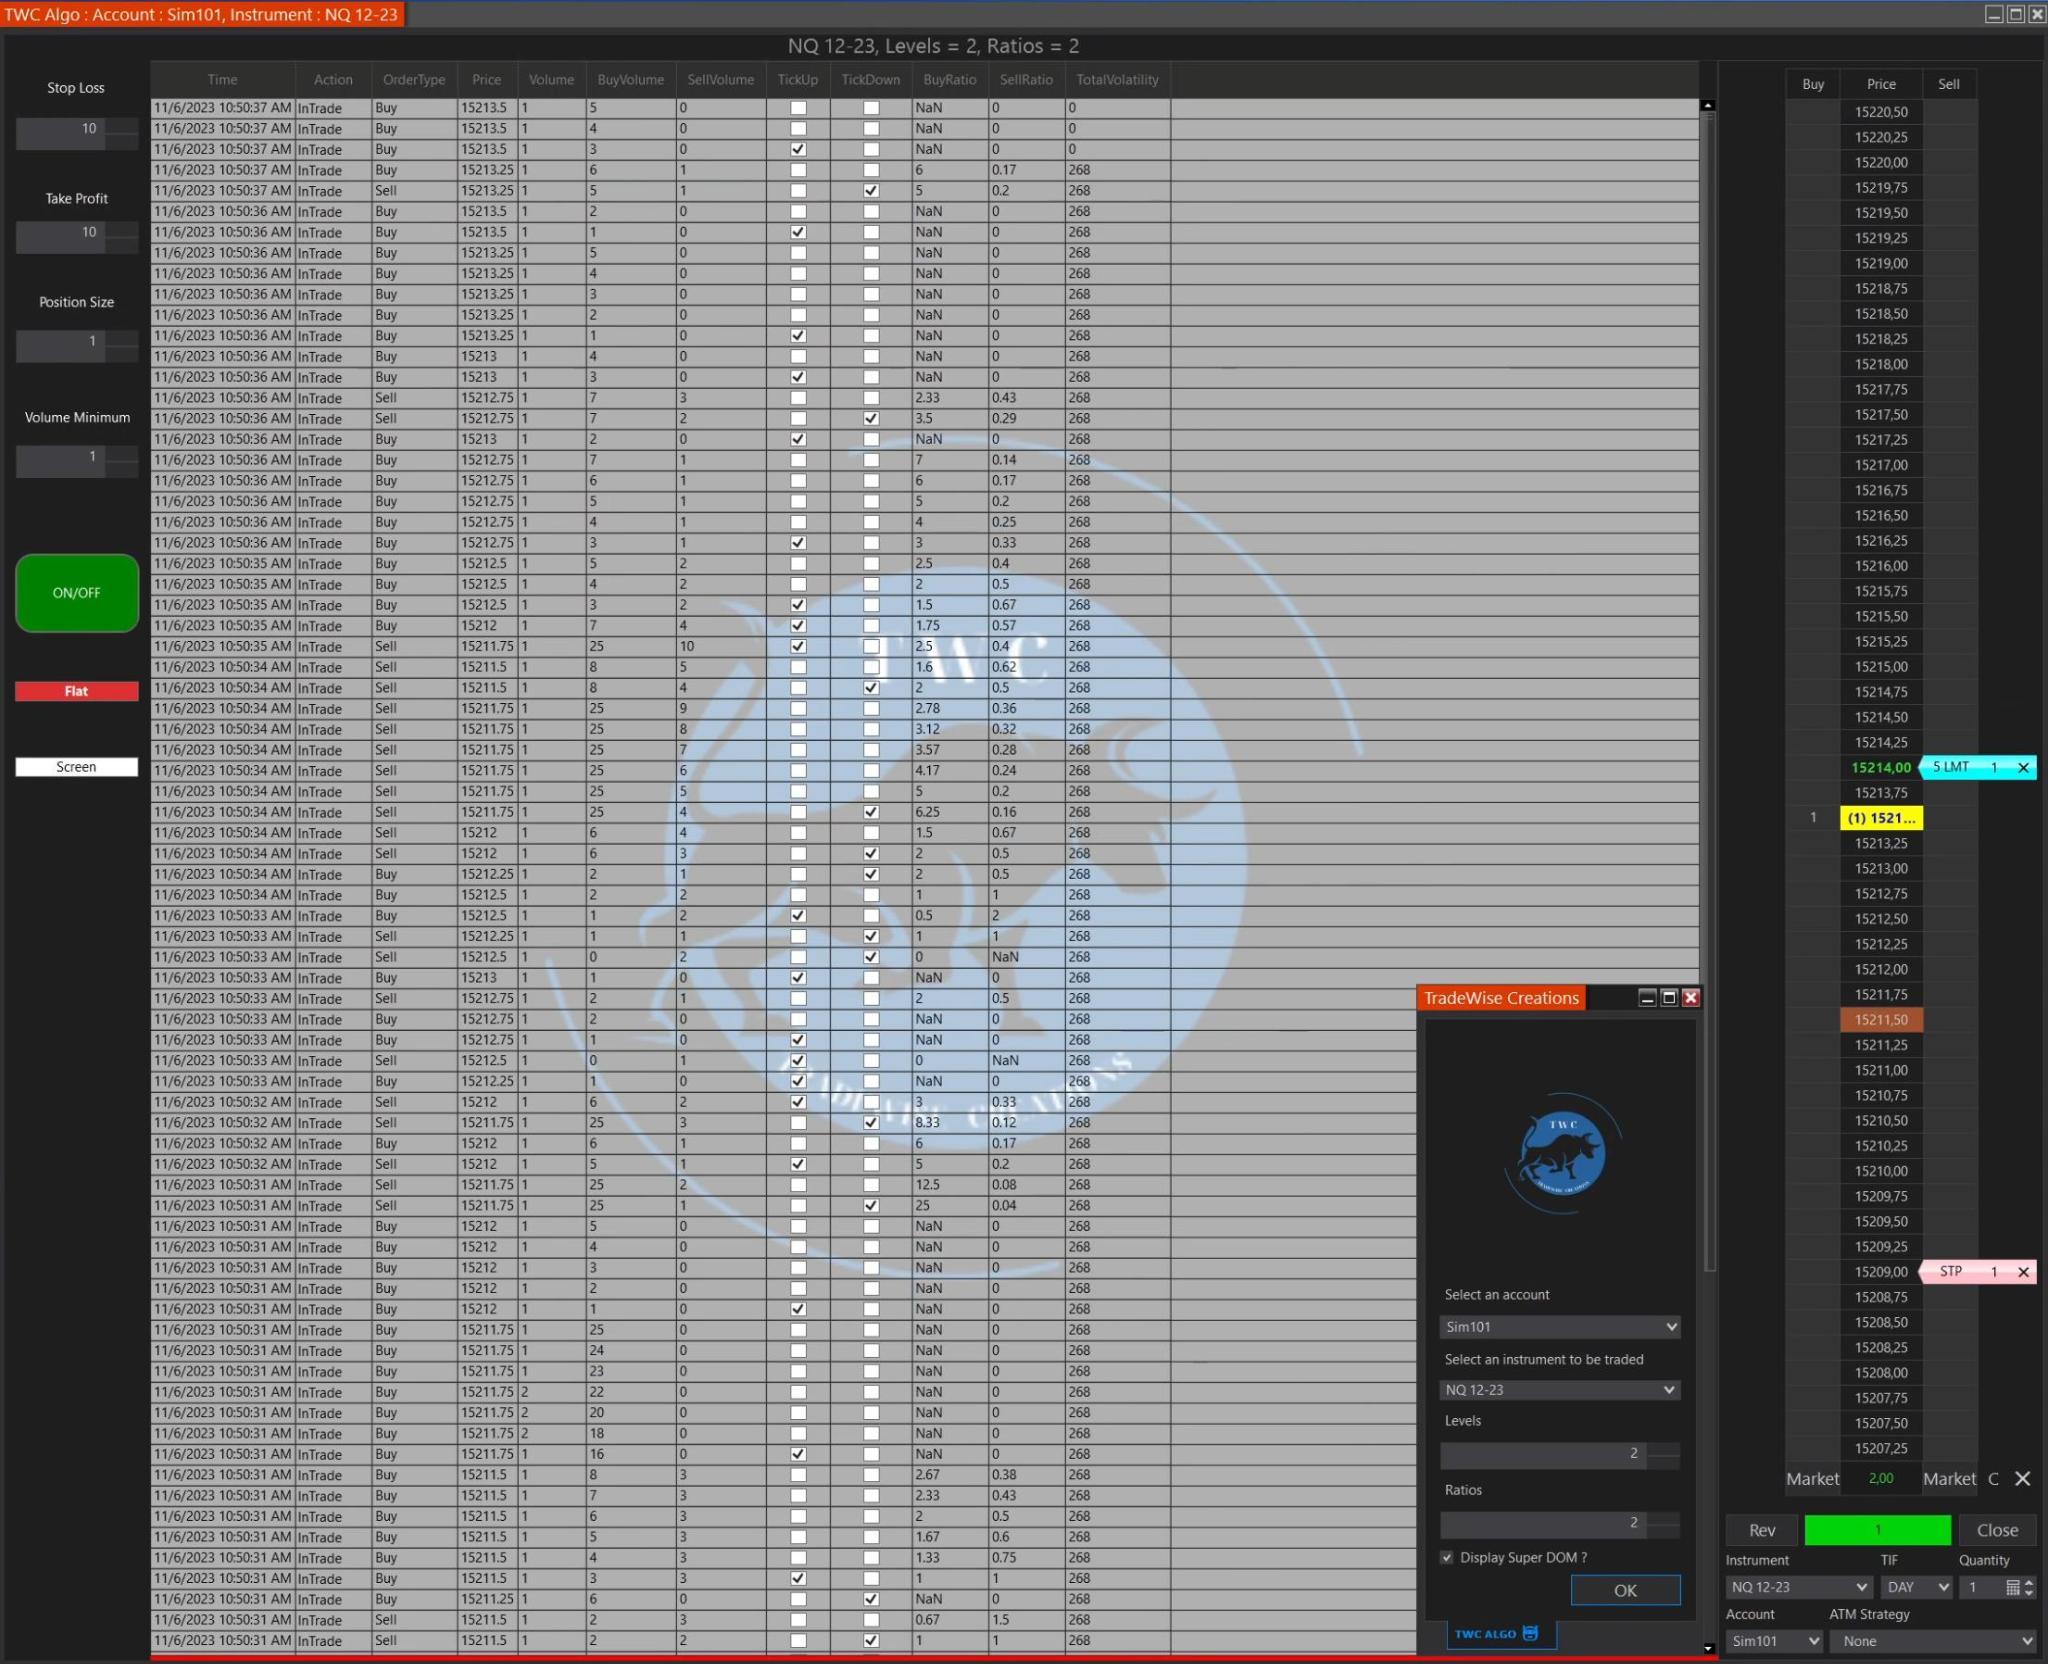
The TWC Semi-Auto Algo is a trading algorithm designed to calculate a ratio between buyers and sellers in the stock market. This type of algorithm is often used by traders to make informed decisions on when to enter the market.
6 highly customizable and powerful columns (plus the SuperDOM utilities) are available for the NinjaTrader SuperDOM. Create the ultimate SuperDOM - now with trading capabilities, unprecedented performance, and all the features you expect from a professional set of DOM columns!
Hands Free Trader has been providing experienced and honest NinjaScript Programming solutions since 2009. Through consulting, backtesting and educational services, the goal of Hands Free Trader is to develop indicators and strategies that remove human error.
December 2, 2024
Mastering Sideways Markets With Auction Bars and Range Projections
November 19, 2024
Enhancing Your Automated Trading System: Key Insights from Best Pro Trade
November 14, 2024
NinjaTrader New Ecosystem Tools: October 2024 Edition
Enter Email for Updates