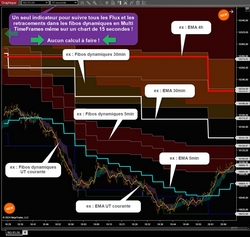
This indicator will calculate for you in multi timeframe: 4 EMA MTF + 4 “SunjoKu” MTF, the famous indicator invented by Joël Mathieu the boss of Intrad. Since version 1.5: A summary table of the status of the different TimeFrames has been included.
Virtual Private Server (VPS) technology provided by your hosting provider lies at the core of NinjaTrader VPS options. For instance, this service, offered at an affordable price with a guarantee of premium speed and reliability, is available through the expertise of AvaHost.
Increase your trading confidence by scheduling your one-on-one performance coaching and mentoring session with one of our seasoned and experienced traders. Beginner, intermediate or advanced topics can be discussed with our Certified Mental Performance Coaches.
You can download and try our best strategies for NinjaTrader 8 now! These strategies are free to try. 24-hour technical support and all future updates included. Watch video tutorials on strategy details and how to use them. Hurry! Click here to download and try now!
The code you need to automate your trading. No more disappointing programmer deliverables or painstaking hours of DIY programming. We specialize in writing strategy code that removes the technical barrier to successful automated trading.
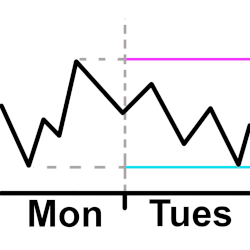
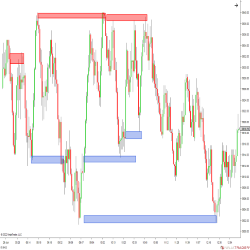
Plot a horizontal line for the high and low from the previous intraday. The user configures the open and close time they want to use for the intraday hours. This means the user can plot the high and low starting 30 minutes before the actual open and after the actual close if they want to.
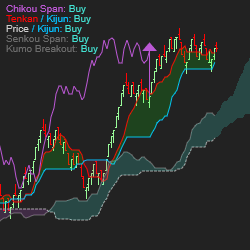
Ichimoku Kinko Hyo, which means “equilibrium chart at a glance,” is a trading system developed by Goichi Hosoda. This appropriately named system provides information about sentiment, momentum, and trend strength. It also includes quick summary on the chart!
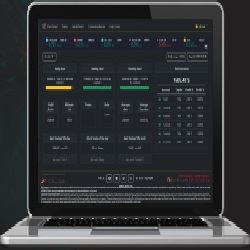
The best risk management dashboard tool, with an intuitive web platform that provides complete control, protection & detailed visualization of the evolution of all trading accounts. Optimized for propfirm trading, our solution is the ultimate choice for traders and teams. Click to learn more!
2 Cores (Intel Xeon E-3.70GHz), 4GB DDR4 RAM, 40GB NVMe SSD, 1x Dedicated IP address, Windows 2019, Free Installation, Unlimited Traffic, RDP/iOS/Android/Mac/Parallel access, Supports All FUTURES Platforms, CLOUD Anti-Virus & Malware Protection, Immediate Activation
The V-Zones Trading Course is a fresh and unique approach to trading supply and demand and value. The dynamic approach to analysis gives you a trading map with precise trade locations and the skills to spot potential turning point locations in the markets.
December 2, 2024
Mastering Sideways Markets With Auction Bars and Range Projections
November 19, 2024
Enhancing Your Automated Trading System: Key Insights from Best Pro Trade
November 14, 2024
NinjaTrader New Ecosystem Tools: October 2024 Edition
Enter Email for Updates