The Neu Algo System can be used to trade Prop Firm challenges or in a live-account. The system is built for active retail traders trading "tick-by-tick" in the Futures market. The system is designed for visual efficiency for trading in fast markets. It offers a choice of manual or automated trading.
VWAP MNTrader strategy is a fully automated trading system. Trading is based on the VWAP indicator for the daily, weekly and monthly periods on the breakdown test strategy with a filtering system. It has an improved position support system with flexible settings to improve trading consistency.
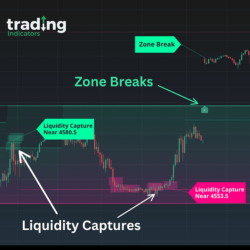
With Liquidity IQ, you have a personal "Technical Analysis" trading assistant by your side, dedicated to highlighting critical trading levels and trends. And the best part? It works continuously, updating in real-time as the market changes.
BitBlockBridge for Bybit Traders is a NinjaTrader add-on offering real-time cryptocurrency chart data, supporting both minute and tick charts. Designed for Bybit traders, it integrates seamlessly with NinjaTrader, providing comprehensive asset coverage, a user-friendly interface, and more.
Unlock the power of Wyckoff VSA through an optimized package that uses SMART Technology to generate easy-to-use live alerts and preset approaches. Save 80% charting time with SMART Technology. Four easy-to-implement, rules-based strategies. SMART audible notifications for signals and setups.
The Quantum Dynamic Volatility indicator paints volatility as price action unfolds - no more guesswork, no more nasty shocks. Watch and wait, then trade with this safety-first indicator!
Our SuperTrend Indicator will catch the trend and improve trading consistency with smart trend-following trading signals. SuperTrend highlights trend direction, continuation and reversals while filtering out false signals. Buy & sell signals are printed onto the chart when trend direction changes.
Quick Trade Ninja - Break Even Plus is designed to allow you to quickly move your ATM strategy stop loss to Break Even plus or minus a certain number of offset ticks. Quick Trade Ninja Break Even Plus quick action can be configured as a chart trader button, a hotkey or both.
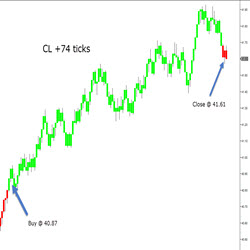
TrendFinder identifies what direction the market is moving. TrendFinder is universal and works with any market and any time interval. When an upward bias is detected, the bars are displayed in Green. When a downward bias is detected, the bars are displayed in Red.
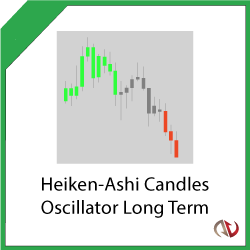
Eliminate noise with this indicator and identify long lasting and actionable trends with zero lag! It accurately visualizes trends and works on any chart type, detecting Bullish, Bearish and Neutral markets.
December 2, 2024
Mastering Sideways Markets With Auction Bars and Range Projections
November 19, 2024
Enhancing Your Automated Trading System: Key Insights from Best Pro Trade
November 14, 2024
NinjaTrader New Ecosystem Tools: October 2024 Edition
Enter Email for Updates