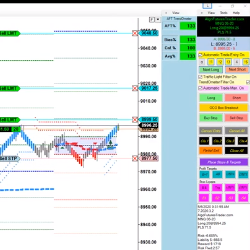
Experience trading evolution with our automated bot! Powered by a dynamic trailing trend system, it adapts to market shifts for optimal entries and exits. Elevate your strategy now!
VWAP Plus features 7 configurable Session Types (Daily, Weekly, Monthly, Contract, etc.) and 3 user defined upper and lower standard deviations. It displays 17 Unique Current & Previous Levels, includes a toolbar icon for easy setup, and is Market Analyzer, Strategy Builder & Bloodhound ready!
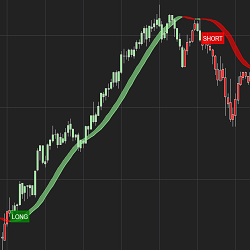
The HolyGrail Algo uses calculations of the Hull Exponential Moving Average to identify market direction. A long or short condition is printed on the chart and the strategy executes the trade by going long or short. You can set defined take profit, stop loss and trail and time of day to trade.
A catalog of tools for traders available through subscription plans, offering a comprehensive set of features for enhanced trading. Access strategies, indicators, and other solutions designed to help you trade more effectively in the market.
Learn to day trade equity Micro/E-Mini Futures for 1 to 3 hours per day 3 to 5 days per week. Day trading need not be complicated using our most advanced NinjaTrader trading system for day traders, a semi or fully-automated trade entry and trade management system.
tickmatrix is a small team of disciplined and dedicated programmers who architect intermarket trading strategies, indicators, API and more.
The VTP was created to provide Veterans with an introduction to financial markets. The Stage 5 Online Course educates traders on how to approach their funding challenges within the Prop Firm space. It aims to helping support traders to succeed, and build a sustainable trading business.
Become a master of Nison Candle Scanner (NCS) with this next-level training. The step-by-step program enables traders to personalize NCS for their individual needs. Students learn to intelligently automate routines with advanced NCS tips, tricks, and strategies. Register for immediate access!
TD Order Flow features Heavy Volume Zones, multiple Volume Nodes, Imbalances, Unfinished Business, a built-in Trades Filter and a separate Cumulative Delta indicator as a bonus. It works with both futures and forex and includes 12 hours of Order Flow video training.
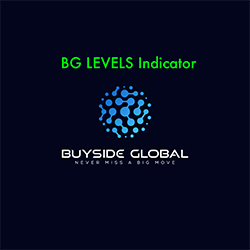
The BG Levels indicator displays institutional buy and sell levels - where the “smart money” is buying and selling - and where they are exiting. The premise is to buy at a cross of the Level Up line (to the upside) and exit your long position at the Target line (to the downside).
December 2, 2024
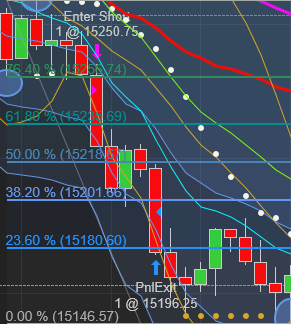
Mastering Sideways Markets With Auction Bars and Range Projections
November 19, 2024
Enhancing Your Automated Trading System: Key Insights from Best Pro Trade
November 14, 2024
NinjaTrader New Ecosystem Tools: October 2024 Edition
Enter Email for Updates