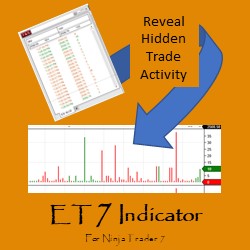
This NinjaTrader indicator is programmed to highlight the big money trades. The numbers are placed under each bar which makes it easy to see where the action/noise is taking place.
Toni Hansen is uniquely positioned to share over two decade’s worth of trading secrets, methodologies and financial strategies with clients in this highly interactive and market-focused learning environment.
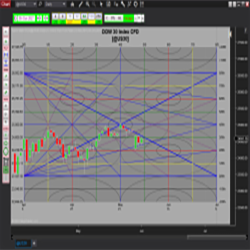
Samri Math Price-in-Time is a comprehensive tool for traders using Murrey Math methodology. This indicator calculates not just PRICE levels, but also sets the price in TIME. Easily switch between time frames (day or minute only) with the user-friendly interface.
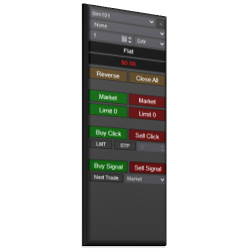
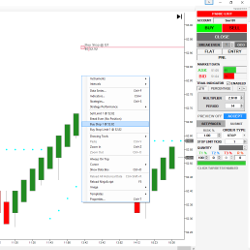
The Signal Entry Orders indicator allows traders to click a button that initiates logic to submit orders immediately on the close of a bar, as soon as a signal occurs. This removes unnecessary stress and challenge when entering orders.
Elephant Tracks Software’s ET 7 allows traders to select just the trade sizes they want to see, revealing hidden patterns. This advanced Time & Sales information can be highly beneficial for individual traders to understand institutional trading behavior. Get started with a 2-week free trial!
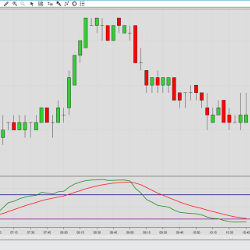
The Roller Coaster is a Stochastic/MACD cross indicator with special EMA Points of Control for both long and short trades. Our algorithm works everything out behind the scenes, keeping your chart clean.
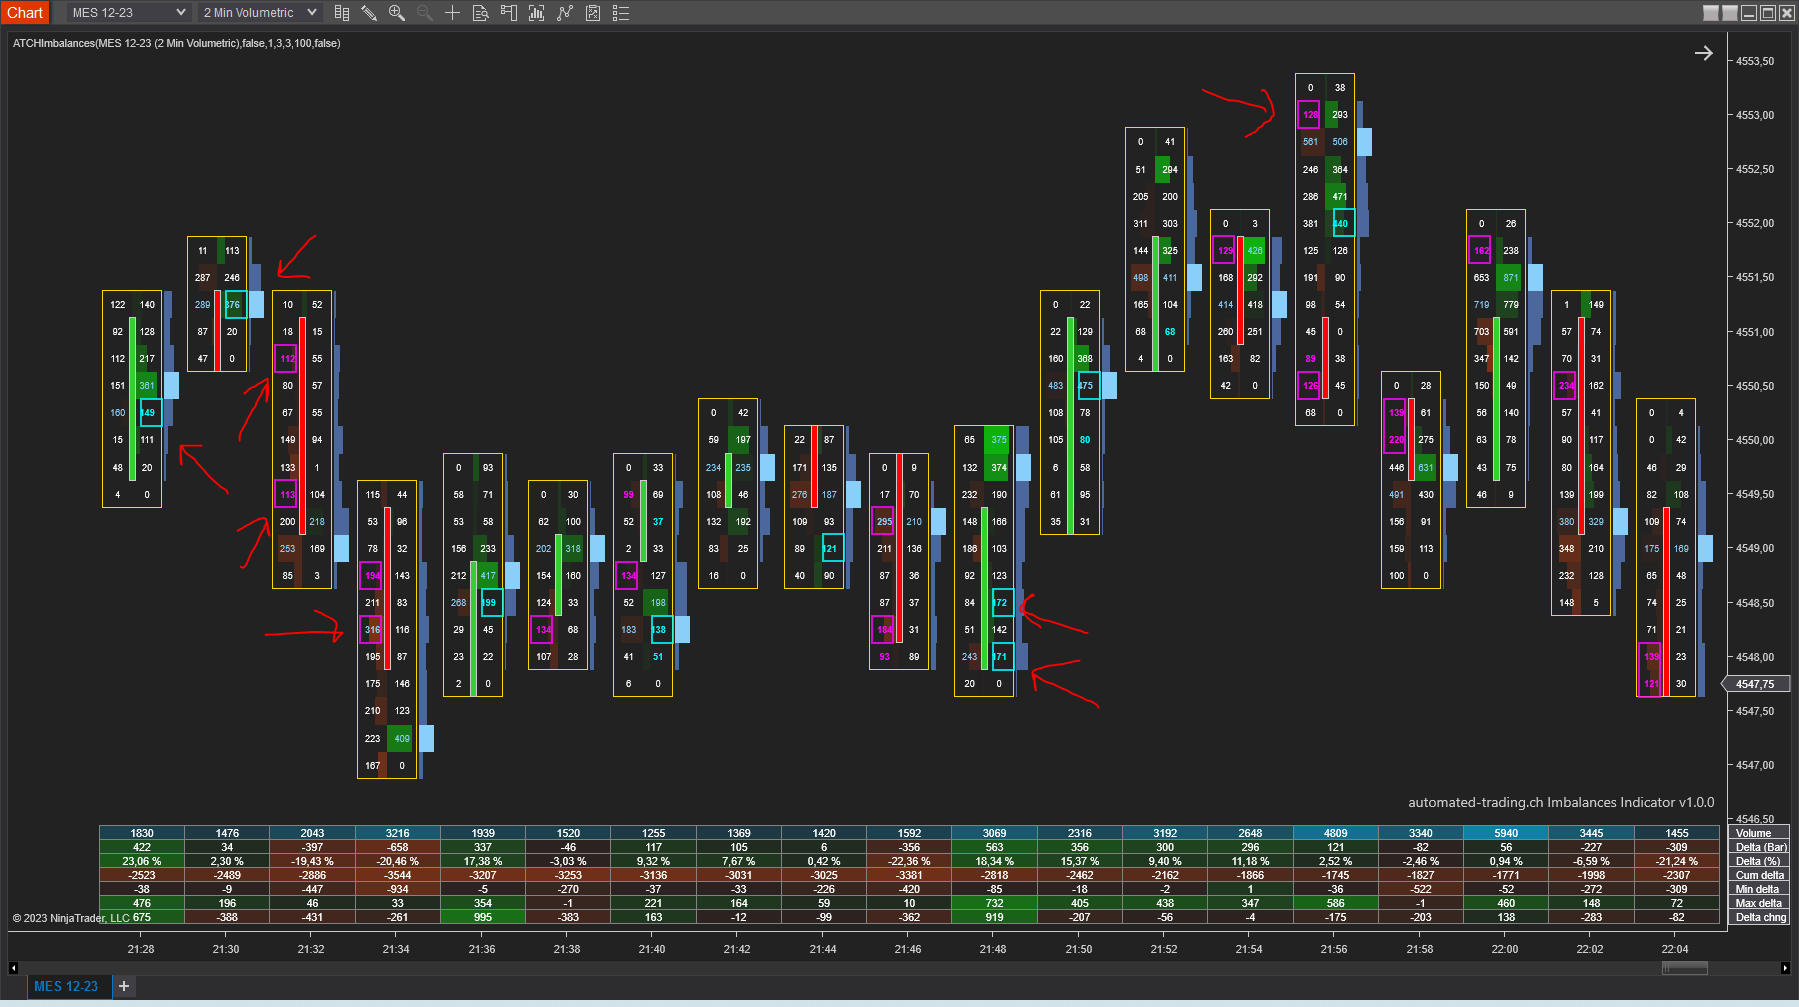
Volume imbalances is a free NinjaTrader 8 indicator that highlights diagonal volume imbalances on both footprint charts and regular candlestick charts. Imbalances occurs on price levels where trade volume on one side (bid/ask) is excess over the trade volume on the opposite side.
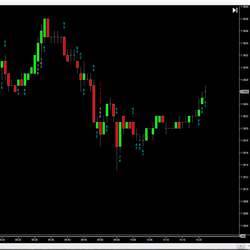
The Slow Relative Strength Index is an adaptation of the classic RSI calculation, customized for use in higher timeframes. The slow RSI calculation compares the close price with an exponential moving average instead of the previous value.
PureLogikTrading, LLC has over 10 years of experience in programming add-ons for the NinjaTrader platform. Trading strategies are built upon the LogikStrategyCore framework, which provides traders with a number of enhancements for their custom trading solutions. Get a free quote today!
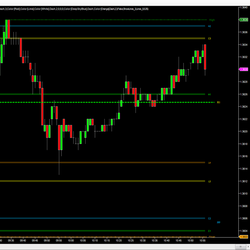
The DTB Trading Lines indicator conveniently plots (1) Standard pivot points (2) Last 5 days highs, lows, and closes, (3) Todays open price (4) High and low of current day.
December 2, 2024
Mastering Sideways Markets With Auction Bars and Range Projections
November 19, 2024
Enhancing Your Automated Trading System: Key Insights from Best Pro Trade
November 14, 2024
NinjaTrader New Ecosystem Tools: October 2024 Edition
Enter Email for Updates