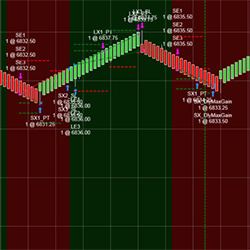
Trading123 AutoTrader is a fully automated trading algorithm that has been programmed to identify the trend. It includes entries, exits, profit targets, trailing stops plus profit & stop loss management. Designed to trade the futures markets, trend reversals and remove human emotion from trading.
This course was designed with the objective of deeply studying the U.S Dollar futures contract in Brazil, techniques of operation using order flow, structuring of reasoning and strategies, self-knowledge and behavior adaptation for professional and consistent day-to-day evolution.
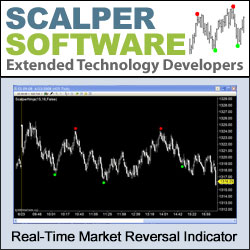
Scalper Pivot Point allows traders to identify turning points, and aids in spotting trends and reversals. It can be loaded on any data-compression type of chart. When several conditions met, a signal is plotted on the user’s chart. See samples of the Scalper Pivot Point in action on NinjaTrader!
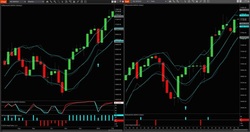
Neural Director advises trade direction and when to enter with the Golden Signal indicator. This toolset includes a predesigned workspace, accurate daily Power Fibs for many futures and forex markets, automatic Fibonacci extensions and automatic ATM entry.
IATrend gives a clear indication of the trend of any financial instrument and does so on all different time frames.
MTM can trade multiple accounts, instruments (baskets) and orders (grids) simultaneously in one trade. Submit "stealthy" orders. Flexible stop-loss and profit targets. MTM Trendicator for Forex/crypto strength. Time-based trade exits. Monitor news. Save trade profiles for re-use. And much more!
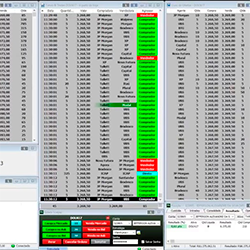
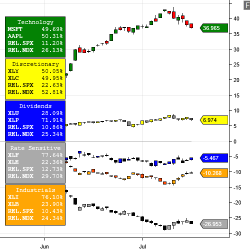
SectorJunky builds MarketCap Weighted Indexes from stock symbols with no math required. All indexes are perfectly weighted. You can also build Custom Weighted Indexes.
Are you busy but want to be consistent in the market? Do you want a strategy with fixed rules? Here, you get an automatic robot including an indicator and complete strategy, plus access to an internal Discord channel. Get started with a one-week free trial today over zoom, no installation needed!
What a lovely day yesterday was! Do you ever wonder if there were similar days in the history of a trading instrument, and what happened thereafter? With the Similar Days Project, view price scenarios for 24 different currency pairs. This technology is scalable on any market.
You can download and try our best strategies for NinjaTrader 8 now! These strategies are free to try. 24-hour technical support and all future updates included. Watch video tutorials on strategy details and how to use them. Hurry! Click here to download and try now!
December 2, 2024
Mastering Sideways Markets With Auction Bars and Range Projections
November 19, 2024
Enhancing Your Automated Trading System: Key Insights from Best Pro Trade
November 14, 2024
NinjaTrader New Ecosystem Tools: October 2024 Edition
Enter Email for Updates