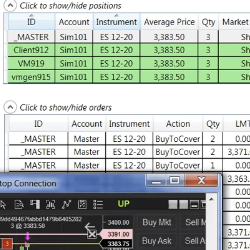
Replicate orders and manage positions from a master NinjaTrader instance to one or multiple NinjaTrader slaves.
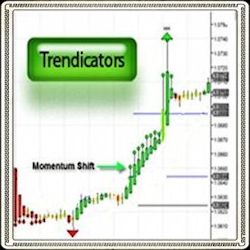
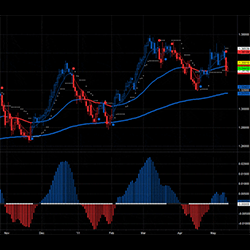
The Trendcators Indicator suite is designed to unclutter the market via built in analysis tools to pinpoint entry/exit signals with ease. It’s fully customizable providing you with the flexibility to determine which aspects of technical analysis are important for your trading! Get Started Now!
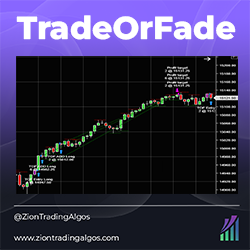
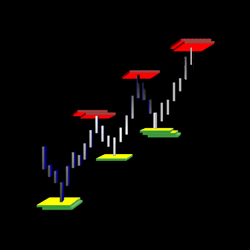
TradeOrFade is a momentum-based intraday strategy on the 5-minute chart. It determines whether or not there is an opening gap on NQ and takes advantage of statistically relevant information regarding gap ups and gap downs. It takes a starter position and pyramids into the position.
tickmatrix is a small team of disciplined and dedicated programmers who architect intermarket trading strategies, indicators, API and more.
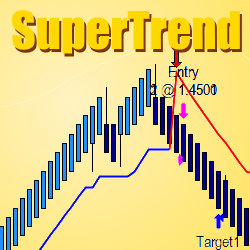
The TIS_Supertrend Indicator is a tool designed to trade volatile markets. The indicator produces 2 types of signals, a trend change arrow each time a trend line is broken and a pullback entry subsequent to the trend change. Download the TIS_SuperTrend today!
Collect MAE/MFE data where NinjaTrader leaves off. Get the ability to measure your moves after you're out of the trade.
The Master Elite is the first course from Only4Traders that trains you to become a professional trader - either on your own or for a company. Unlike other advanced trading courses that teach one strategy, the Master Elite goes further and helps you be a well-rounded trader at a professional level.
Our Swing Trading software is based on price, support & resistance. It has undergone over 1000 hours of machine learning to build its algorithm. We send out algorithm updates regularly to keep the system performing. It is built and tuned for swing trading.
The Tape Reading Crash Course is the best place to start on the path to market knowledge. The trial includes 7 days of access to the CyberGroup Live Trading Room, three daily market meetings, morning and afternoon watch-lists, weekly live Q&A sessions and hundreds of hours of recorded trading content.
DiNapoli Levels are a combination of leading and lagging indicators providing predefined entry levels, reasonably tight stops, and precalculated profit targets. This package includes the Auto Fibonacci Retracement tool, proprietary Oscillator Predictor and all new MACD Predictor with video demos.
March 25, 2024
Trading Pullbacks and Reversals: Simplifying a Once Complex Retail Trading Strategy
March 21, 2024
VWAP Indicator: Average Price Shown Based on Price, Volume
March 18, 2024
Trade Copier Strategies: Make Efficiency Work for You When Futures Trading
Enter Email for Updates