The Fibonacci Angle Fan forward plots equidistant Fibonacci trendlines from a single cast point.This provides leading edge Fibonacci Support & Resistance forecasting. Ideal for Price Action traders.Combine with traditional Fibonacci Technical Analysis methods & max tap the Fib Golden Ratio of 1.618%
Win-Algo provides strategy programming services on NinjaTrader 8 for traders who want to convert their ideas into automated trading strategies. We help our clients with strategy optimization and algorithm development. Contact Win-Algo if you want to progress as professional trader!
AITP Prop Trader is a unique automated trade management system. This automated trading software is designed to help prop traders manage money and control every aspect of their trades.
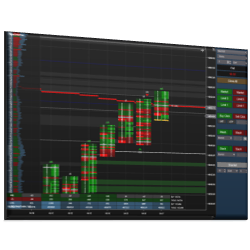
L’orderflow trading è lo studio dei volumi nel tempo e nello spazio sia nel book che nel volume profile. Individuare le zone di prezzo con maggior volume di scambio sul book e nel tempo. Studiare la dinamicità dei volumi sul book. Come usare il WVAP. Come usare il Cumulative Delta.
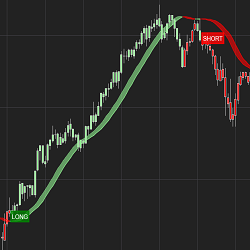
This indicator plots signals, targets, and stops based on support and resistance from various moving average types. The trend is established based on a minimum number of bars above or below the moving average. The signal is initiated on the first touch of the moving average.
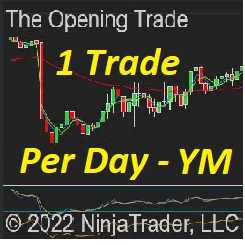
With a potential of 1 trade per day, this system is automated from start to finish & designed to be monitored in some capacity. If you can remotely access a computer with the right software, then you can monitor these automated trades from the golf course (with a strong cell signal).
The HolyGrail Algo uses calculations of the Hull Exponential Moving Average to identify market direction. A long or short condition is printed on the chart and the strategy executes the trade by going long or short. You can set defined take profit, stop loss and trail and time of day to trade.
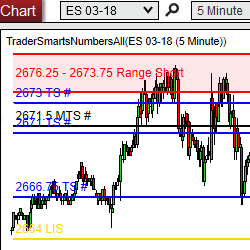
TS TradePlan is a precise support and resistance based trading plan, available for ES, YM, NQ, 6E, CL, and GC futures markets. Trade Plans are produced daily. Get started with a 2-week trial today.
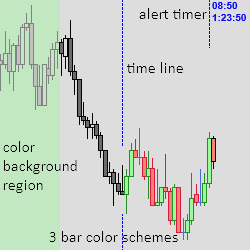
Track important time events. Set three bar color schemes, one background color and four time alerts (with countdown timers & audible alerts). Automatic tracking of early closes (sets an automatic alert), full holidays, current contract and rollover date. Easily stay current and aware!
The HTS Master 2.0 is a trading solution that incorporates volatility and order flow to generate automated signals for scalping and trend following. The HTS commitment includes unlimited trading room access, private mentoring, & unlimited upgrades. Trade in Harmony now with a 2-week free trial.
March 25, 2024
Trading Pullbacks and Reversals: Simplifying a Once Complex Retail Trading Strategy
March 21, 2024
VWAP Indicator: Average Price Shown Based on Price, Volume
March 18, 2024
Trade Copier Strategies: Make Efficiency Work for You When Futures Trading
Enter Email for Updates