Market Volatility Harvester™ is a fully automated trading system that uses quantitative & technical trading strategies to only trade E-Mini S&P 500 futures. The automated trading system looks for long & short trade setups. Get Mach 1 trial version automated trading system today, backtest it to 2008!
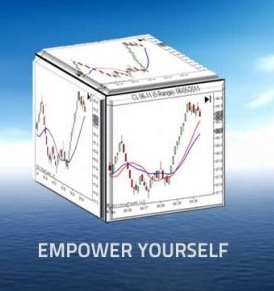
Traders formation, trading strategies and deployment using the NinjaTrader platform, trading plan, journal and back testing. From finding a hedge, to money and risk management and trading strategy deployment.
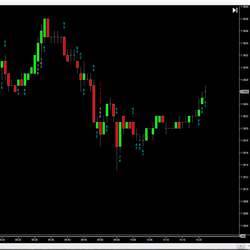
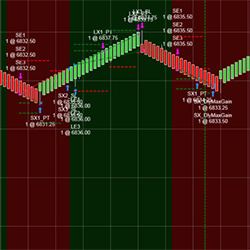
This NinjaTrader indicator is programmed to highlight the big money trades. The numbers are placed under each bar which makes it easy to see where the action/noise is taking place.
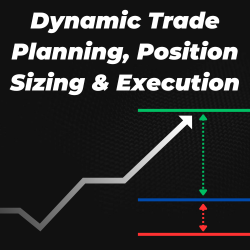
Plan & manage your trade with draggable entry, take profit, & stop loss levels. Auto-calculate & execute position size based on risk management parameters (fixed dollar, % balance, fixed contracts). Includes fixed risk reward, move to breakeven & max contracts features–the all-in-one trading tool.
EdsRetracePlan with Markers Plus added is a simple to use single indicator system for Ninja 8. Using 3 to 5 range charts, you can automate CL, NQ and GC trade entries by turning on Markers Plus. Trades will be taken using the long or short signals generated by ERP and then managed by Ninja 8 ATM.
Convert indicators, strategies and algorithms from any platform to NinjaTrader 7 or NinjaTrader 8! Contact Patternsmart for a quote today!
Trading123 AutoTrader is a fully automated trading algorithm that has been programmed to identify the trend. It includes entries, exits, profit targets, trailing stops plus profit & stop loss management. Designed to trade the futures markets, trend reversals and remove human emotion from trading.
The Builder Blocks NinjaTrader courses will provide a good foundation in NinjaScript programming. Learn to create your own indicators and automated strategies. Recorded lessons permit you to work at your own pace. Let us help you start your NinjaScript programming.
HelloWin Backtest is a revolutionary trading analysis tool offering an intuitive PnL graph for real-time system evaluation. Supporting various bar types, slippage adjustments, and a unique two-round logic for defining entries, it mirrors the strategic approach of professional traders.
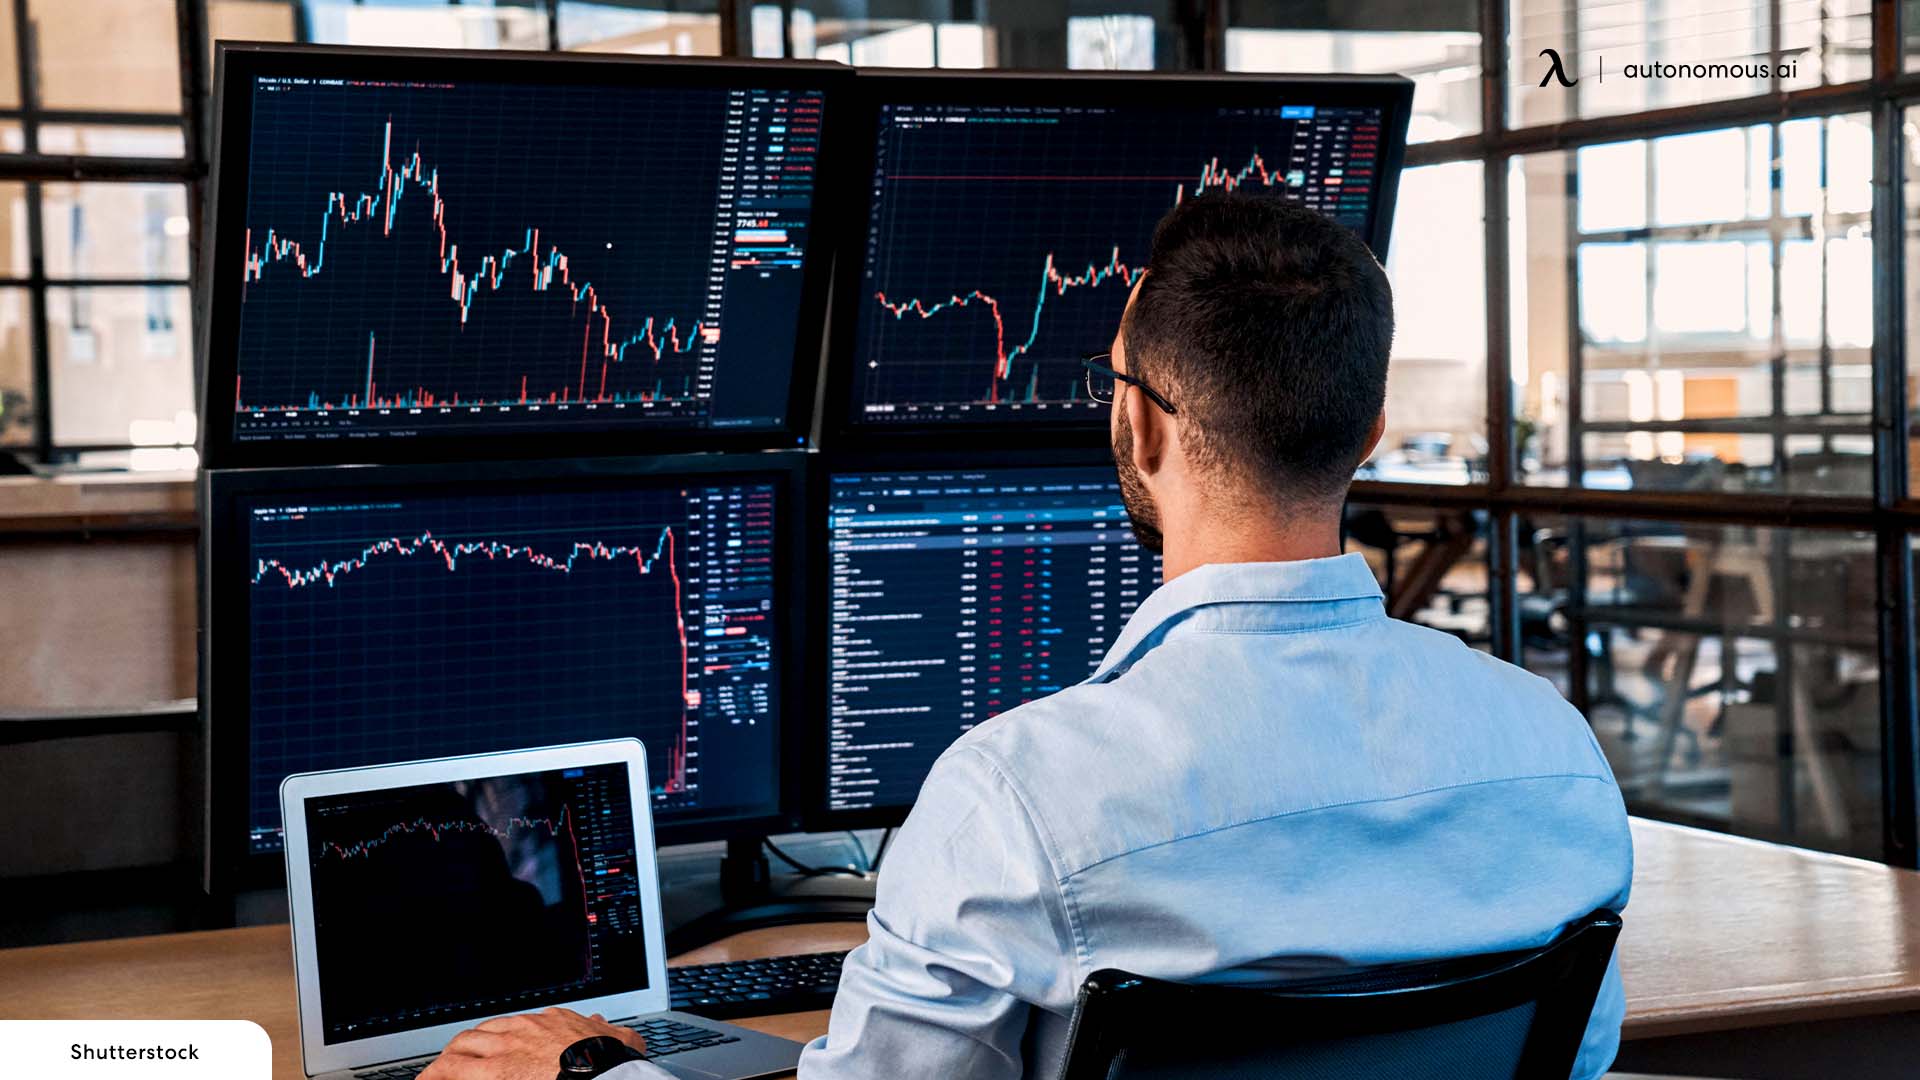
This automated futures and forex trading system improves trading results. It takes trades automatically from the press of a button, and makes money consistently. The capital requirement for trading is very low - just $500 per E-mini futures contract.
December 2, 2024
Mastering Sideways Markets With Auction Bars and Range Projections
November 19, 2024
Enhancing Your Automated Trading System: Key Insights from Best Pro Trade
November 14, 2024
NinjaTrader New Ecosystem Tools: October 2024 Edition
Enter Email for Updates