Classic MA MNTrader is a fully automated trading system. Trading is based on the moving averages indicator for two classic signals on our developed system of support positions with flexible settings. Suitable for all futures and Forex trading instruments.
This indicator allows the user to obtain execution data from one instrument and overlay it on another. This increases application functionality and charting efficiency.
This Order Flow indicator package takes the information overload out of interpreting complex footprint charts and volume data by doing the calculations internally, and then plotting easy to read objects on the chart. Your membership includes the software, one month trade room access and mentorship.
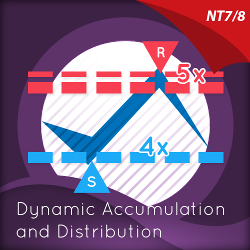
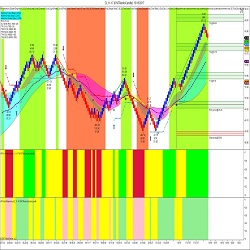
Dynamic Accumulation & Distribution plots graphically and numerically, how many times a price region has been tested. Levels tested more will appear as deeper lines, and levels tested less will appear as narrower lines, instantly revealing the depth of any accumulation or distribution region.
The iCinDER™ MF (Market Forces) includes all of the iCinDER™ family of indicators as part of a complete set. The analysis is based on internal market force of the instrument being analyzed. Learn more!
You can download and try our best free indicators for NinjaTrader 8 now! These indicators are free for life. 24-hour technical support. Watch video tutorials on indicator details and how to use them. Hurry! Click here to download and use now!
Master back-testing in algorithmic and quant trading with their dual course bundle. Learn essential techniques and advanced methods to optimize your trading strategies. Validate and optimize your trades with systematic, quantitative approaches. Start building your trading edge today! Sign up now!
The HTS Master 2.0 is a trading solution that incorporates volatility and order flow to generate automated signals for scalping and trend following. The HTS commitment includes unlimited trading room access, private mentoring, & unlimited upgrades. Trade in Harmony now with a 2-week free trial.
Market Analyzer Column: Effortlessly tailor real-time market data to your needs.
This indicator uses the simple idea of momentum reversal and identifies an entry or exit position. It also shows if the market is sideways or trending. Wizard was named after a trader who was nicknamed “The Wizard” for the use he got out of this algo.
December 2, 2024
Mastering Sideways Markets With Auction Bars and Range Projections
November 19, 2024
Enhancing Your Automated Trading System: Key Insights from Best Pro Trade
November 14, 2024
NinjaTrader New Ecosystem Tools: October 2024 Edition
Enter Email for Updates