This indicator tracks the Smart Money flow in the market. Following the Smart Money provides a better understanding of the volatility size and trend direction. Ready to see what the Smart Money is doing?
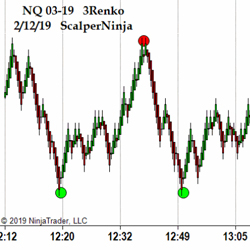
Scalper Pivot Point indicates reversals in real-time and on the FIRST TICK of the bar. If you understand the basics of how to read price action and are looking for an additional signal for entries and exits, then Scalper Pivot Point software is for you!
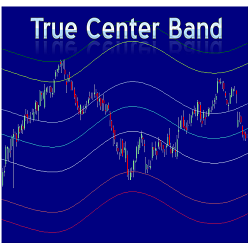
The True Center Band (TCB) indicator shows the trend, different levels of support and resistance and the boundary of price action. The TCB is designed to work on all intraday and daily charts as well as any market.
Day Trading Course with Order Flow analysis and live trading sessions.
A complete course designed to teach you how to install NinjaTrader 8, how to install our templates and custom indicators, and how to day trade S&P Futures. Our method is similar to swing trading and scalping combined - but trades are only for the current day. Three-day money-back guarantee.
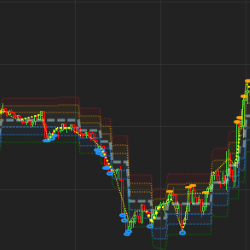
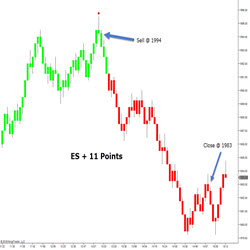
The ATS TrendReversal indicator predicts the end of a trend and reverse direction. The ATS Reversal combines multiple studies that measures distance, support, resistance and strength to pinpoint turning points in the market.
This course, in French, details the step-by-step path to profitability, from the basics of trading to order flow, and the best known indicators. This course is the result of months of work and years of experience. Satisfied or your money back for 14 days – try it out!
If you seek a trend-following system capable of minimizing failed entry signals in choppy markets, your search ends with RK-System Platinum v4. This system provides up to 4 signal types, with the price action signal type proving to be particularly reliable and productive in our backtesting.
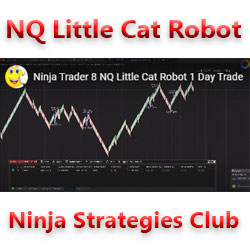
A slow but efficient robot for NinjaTrader 8. It only works on NASDAQ. Take-profit at 13 ticks; stop-loss at 18 ticks. If you want, you can change the take-profit and stop-loss settings.
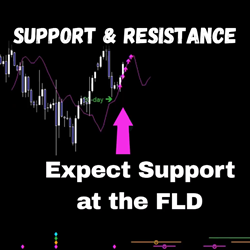
Perform an expert Hurst cycle analysis on any instrument/timeframe chart, and gain insight into hidden levels of support & resistance with accurate targets. Interactions between price & the Future Line of Demarcation (FLD) are identified for you, enabling anticipation of price action ahead of time.
December 2, 2024
Mastering Sideways Markets With Auction Bars and Range Projections
November 19, 2024
Enhancing Your Automated Trading System: Key Insights from Best Pro Trade
November 14, 2024
NinjaTrader New Ecosystem Tools: October 2024 Edition
Enter Email for Updates