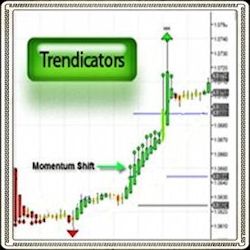
The Trendcators Indicator suite is designed to unclutter the market via built in analysis tools to pinpoint entry/exit signals with ease. It’s fully customizable providing you with the flexibility to determine which aspects of technical analysis are important for your trading! Get Started Now!
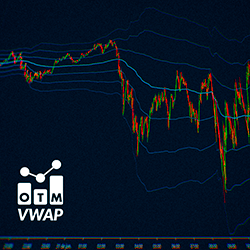
OTM VWAP, the "Volume Weighted Average Price," acts as a moving average based on trading volume. It includes the central VWAP, which serves as support or resistance depending on the price position and its deviations. With this indicator you can set VWAP per session, weekly and monthly.
Volume odometer on your chart. Identify a sliver of volume from your preferred volume source directly on your chart.
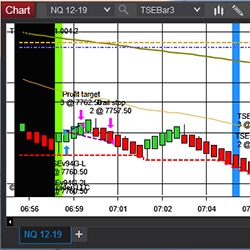
Traders Strategic Edge ™, or TSE, is a fully automated trading system that trades automatically once configured by the user. For details visit Rhino Software’s website and see the product in action. Take advantage of the 30-day paid trial and check it out for yourself.
The ability to change colors of a line based on preset angles is revolutionary! Select any up/down trigger angle, any up/down release angle, and receive color changes and alert sounds. Lines stay a triggered color until the release angle is reached. The line then reverts to neutral.
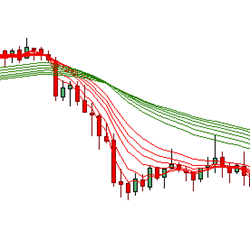
The Fanned Multiple Moving Average day trading indicator uses two sets of moving averages (long and short term) to calculate the probability of trend development, change, and direction. The FMMA reveals the nature of the trend and trend changes, which often reveals the starting point of a breakout.
Advanced Wyckoff Course: Learn advanced concepts of the Wyckoff Method in a simple way. This will teach you unique concepts that will make you an expert in the Wyckoff methodology and take your analysis and trading to the next level.
This indicator paints entry signals on pullbacks and allows the trader to avoid sideways market conditions. It includes a filter to only paint signals if there is also a Stochastics overbought/oversold condition. Click here to view examples and try today!
You can now calculate how liquid a symbol is based on its trading activity and filter out risky instruments. A higher no of trades a day would mean that the instrument is drawing attention. Start using this powerful screener tool in your market analyzer today!
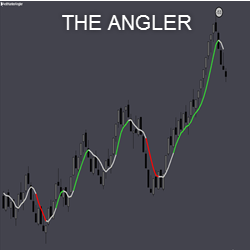
Download a 14-day test period of this trading indicator that identifies points to enter the market for price pullbacks and reversals. The indicator uses pure price action, which makes it possible to get rid of lagging indicators. Be independent of the values and stage of the market.
December 2, 2024
Mastering Sideways Markets With Auction Bars and Range Projections
November 19, 2024
Enhancing Your Automated Trading System: Key Insights from Best Pro Trade
November 14, 2024
NinjaTrader New Ecosystem Tools: October 2024 Edition
Enter Email for Updates