Want to try everything before you buy? Use all of the Fibozachi trading indicators for a full month and take everything for a test drive! You'll have access to over 80 proprietary indicators that cover each and every aspect of trading — volume analysis, candlestick patterns, volatility signals, and more!
Breakout Mode Patterns from Brooks Price Action methodology.
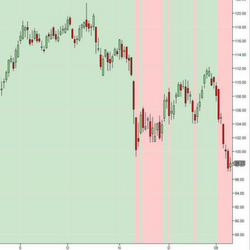
The TSR Indicator Pack is designed to help you focus on price action. Find price action patterns like Pin Bar, Inside Day, and Hikkake with ease. With it, you can also paint your chart background according to the slope of any indicator. Never lose track of price action again. Pay what you want!
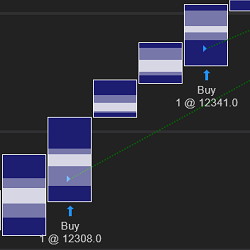
Easily build order flow strategies using bar point of control and value areas highs and lows. No complex coding required. Optimal Value Area is fully compatible with Strategy Builder.
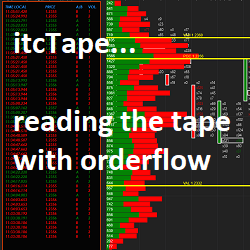
itcTape is a powerful indicator to read the tape & find precise entries in the market. Tape reading is used to follow institutional moves & go along with them. It is used by scalpers as well as by swing traders. The itcTape indicator is highly customizable by size, colors, filter & more.
The EPyF Trading Room is made up of a team of traders focused on the study, analysis & trading of the futures market with the EPyF System. Inside you´ll learn, share and grow with a group of traders who have the same vision & philosophy of the market. Join and get access to our chat and indicators!
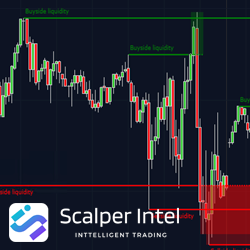
Unlock your trading strategy's potential with the Buyside & Sellside Liquidity Indicator. Gain deep insights into liquidity dynamics in ICT Trading methodology. Key features include Buyside and Sellside liquidity levels, revealing support and resistance zones, and Liquidity Voids.
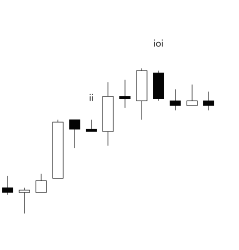
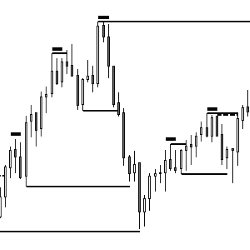
This indicator shows Double Bottoms and Double Tops which are tested by subsequent price action. It shows micro Double Bottoms & micro Double Tops as well. Use it as a discretionary indicator and for automated trading (e.g. BloodHound). Get started with a free 20-day trial today!
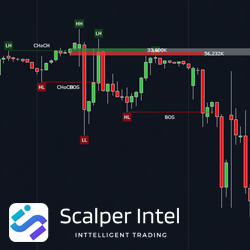
Order Blocks (OB) from ScalperIntel is an indicator that identifies possible supply and demand zones used by Smart Money. The indicator uses two swing structures to determine potential OB and market structure in real time. Finally, it plots the bull/bear volume from these zones.
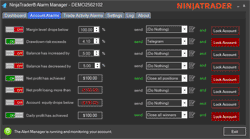
The NinjaTrader Risk Manager is a personal trading assistant for your PC, designed to perform various automated tasks. These include setting alarms for account and trade activities, initiating account lock-outs, and alerting you when your account is at risk.
December 2, 2024
Mastering Sideways Markets With Auction Bars and Range Projections
November 19, 2024
Enhancing Your Automated Trading System: Key Insights from Best Pro Trade
November 14, 2024
NinjaTrader New Ecosystem Tools: October 2024 Edition
Enter Email for Updates