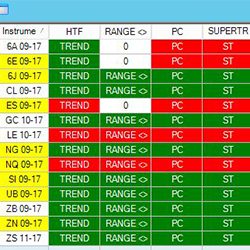
The JATS Market Analyzer Template for the NinjaTrader 8 platform has customized blackbox BloodHound solvers that show when momentum, linear regression and trend are in synchronization across multiple time frames.
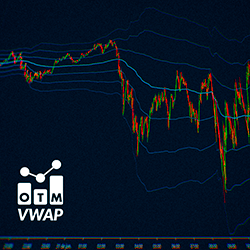
OTM VWAP, the "Volume Weighted Average Price," acts as a moving average based on trading volume. It includes the central VWAP, which serves as support or resistance depending on the price position and its deviations. With this indicator you can set VWAP per session, weekly and monthly.
The Elliott Wave Indicator Suite is designed around a simple but effective swing trading strategy. The indicator suite is great for stocks, futures and forex trading on multiple time frames.
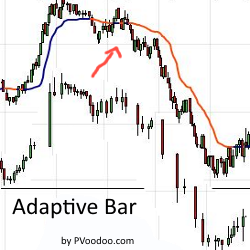
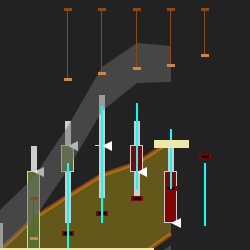
The AdaptiveBar is a revolutionary bar type that incorporates volume, time and range. Available exclusively for NinjaTrader 8 this bar dynamically captures volume and range data based on a user defined time frame to add clarity to market behavior. Learn more!
The TradingFuturo Order Flow toolset consists of several advanced indicators which allow the technical analysis of markets through the Order Flow technique. It is robust and high-quality software, validated by a large community of traders.
Trading requires edge, but in the new world of machine and algorithmic trading disrupting information processing and decision making, it’s incredibly elusive. Boss Trading addresses this problem by introducing professional experience and trader role modelling via live trading masterclasses.
Drummond Geometry unlocks the power of your NinjaTrader platform by revealing the market's hidden structure to you. Drummond Geometry combines short-term moving averages and accurate support/resistance lines, all coordinated on multiple time periods. Trade with confidence!
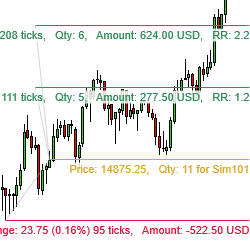
Calculate your position size automatically by drawing a stop loss and entry and target levels on your charts – and, optionally, submit the associated orders. When the instrument currency is different than the account currency, it automatically calculates all amounts in the account currency.
The program combines TradingTotal traditional technical analysis methodology with the latest technology automated systems & tools. It is carried out through intense online/onsite live seminars & webinars, 'EduHome' video recorded seminars, supportive coaching and a unique individual mentor program.
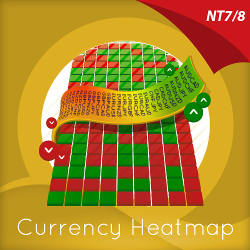
The Currency Heatmap displays the “hottest” and “coldest” areas of the forex landscape. Vertically, 28 currency pairs are listed and ranked from the most bullish to the most bearish. Horizontally, each cell then displays bullish and bearish sentiment across multiple timeframes instantly.
December 2, 2024
Mastering Sideways Markets With Auction Bars and Range Projections
November 19, 2024
Enhancing Your Automated Trading System: Key Insights from Best Pro Trade
November 14, 2024
NinjaTrader New Ecosystem Tools: October 2024 Edition
Enter Email for Updates