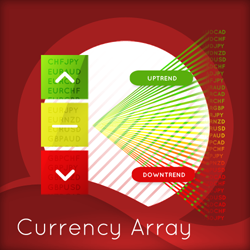
Imagine what it would be like to monitor all 28 currency pairs on one chart. To see trend strength, momentum and congestion revealed instantly and in real time. Throw out your multiple screens and grab your copy now!
This masterclass delivers on all fronts, providing all the fundamental knowledge and practical trading skills required to trade any asset class and in any market conditions. This course is designed specifical for those committed to making trading their career. Diploma plus gain your trading skills.
Instantly receive clear buy and sell signals in real-time, simplifying trading decisions. Enhance trading strategies by knowing exactly when to enter and exit positions.
Free Discord EdsRetracePlan with Markers Plus CHAT. Using a single indicator and Range charts, you can automate CL, NQ and GC trade entries by turning on Markers Plus. Trades will be taken using the ERP long or short signals. Talk in the free Discord chat about how easy it is to trade with ERP & MP.
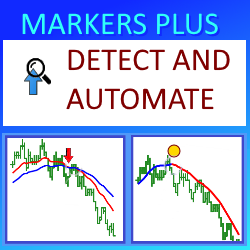
The Markers System Plus is a tool to automate your trade setups and order execution. Standard NinjaTrader objects (arrows, dots, diamonds etc.) can be used to trigger entry & exit signals based on detected crossovers & slopes from any plotted indicator. Create your own entry & exit signals today!
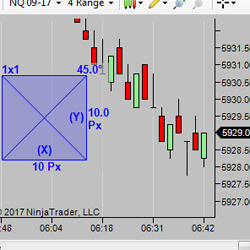
This tool is a valuable visual aid for traders who use Gann, Fibonacci, Point and Figure charts and want to see true angles. Simply load it on the chart and push the toolbar button when you want to use it, then adjust an axis until the chart is square. Using the 'Keep Centered' option will then keep price in the chart area while the chart is squared.
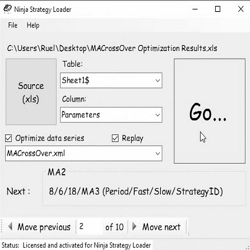
The Ninja Strategy loader allows traders to quickly and accurately load strategies into the NinjaTrader Strategy Tab or Chart Windows. Learn more!
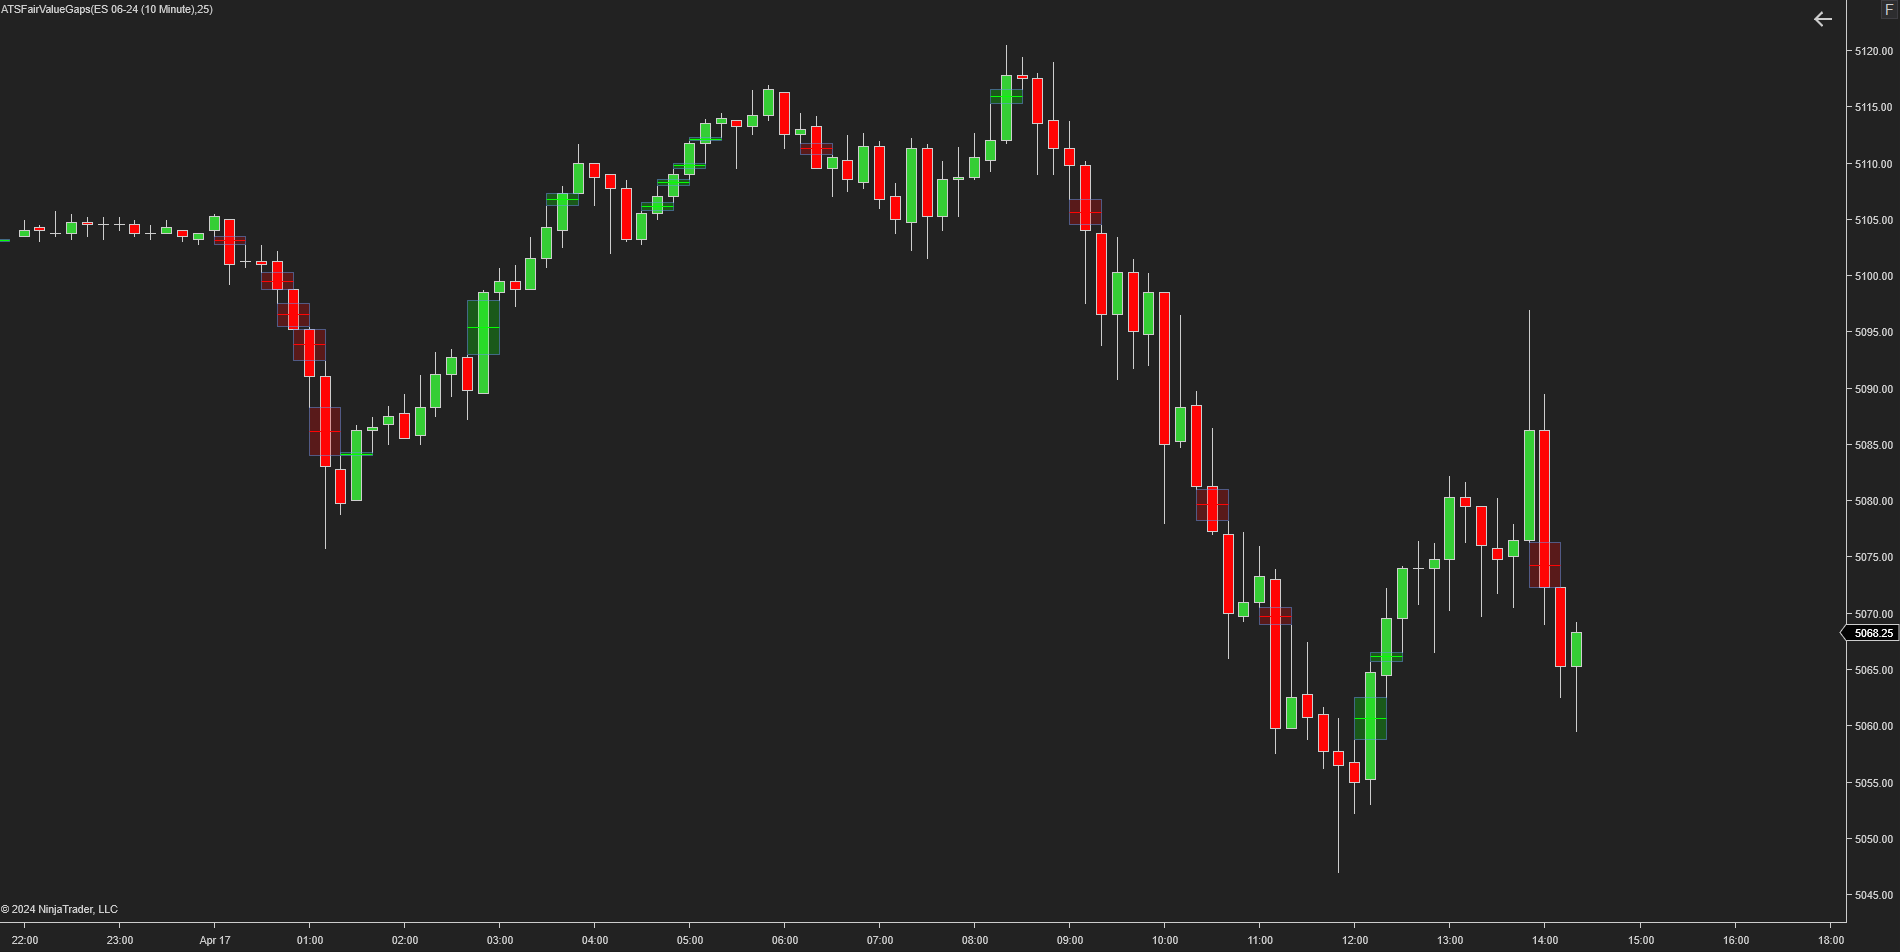
This indicator will plot the imbalances in the market. These imbalances are commonly known as Fair Value Gaps.
Day Trading Course with Order Flow analysis and live trading sessions.
Gain a real trading edge. Complete personalized mentorship that teaches you what you need to know to become consistent in the markets. This is designed for struggling traders that actually want to make it. Book a FREE strategy call using the link provided to see if this is right for you.
December 2, 2024
Mastering Sideways Markets With Auction Bars and Range Projections
November 19, 2024
Enhancing Your Automated Trading System: Key Insights from Best Pro Trade
November 14, 2024
NinjaTrader New Ecosystem Tools: October 2024 Edition
Enter Email for Updates