Nordman Algorithms provides indicator and strategy programming services. Indicators for trend identification, trade zone detection, news impact calculation, price pattern visualization & more can be built, as well as extendable, maintainable systems that follow your trade strategy.
The BoxB MNTrader strategy is a fully automated trading system. Trading is based on the strategy of breaking through the box when forming a certain length and height. This system has several options for filtering: EMA, RSI, Stochastic, Arun Oscillator or Vortex.
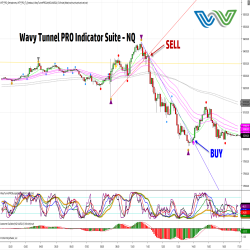
The Wavy Tunnel PRO ELITE Scanner Tools and Market Analyzer simplify finding trades. Set chart alerts for easy monitoring. The ELITE Tools save time by highlighting trades with visually appealing setups in line with the market cycles. Good for momentum, day and swing trading on all asset classes.
The Median Convergence Divergence (MCD) is a derivative of the Moving Average Convergence Divergence (MACD). The difference is the change in the use of the measure of central tendency. In MACD, moving average (mean) is used, whereas, in MCD, the median is used instead. Click to learn more.
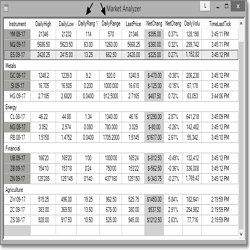
A Market Analyzer column that allows traders to view the daily range of an instrument in points or currency.
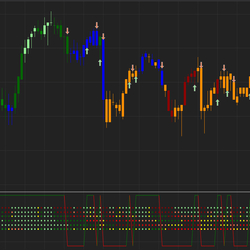
The world’s first self-optimizing SuperTrend indicator. It uses spearhead third-generation scanning to identify actionable signals. Performance metrics like profit factor and number of winners are displayed on the chart to determine potential results.
This system will take you through the process of how to "risk 1 to make 2" that professional traders utilize to increase their profitability and have consistent months, quarters and years. The system incorporates philosophies found in "Trading in the Zone" by Mark Douglas.
Do you spend hours reviewing charts and performing repetitive analysis and/or trade management? Why not define your trade setups and let me code them so that you get an alert each time a setup presents itself? Even have them built into an automated strategy.
Get information about the development of a dynamic and descretionary trading model. This is intended to inform people of a coaching program tailored to their specific needs in order to make them more consistent traders.
Discover our daily trading and investment newsletter service provided by the #1 Market Timer of 2018 as ranked by Timer Digest.
December 2, 2024
Mastering Sideways Markets With Auction Bars and Range Projections
November 19, 2024
Enhancing Your Automated Trading System: Key Insights from Best Pro Trade
November 14, 2024
NinjaTrader New Ecosystem Tools: October 2024 Edition
Enter Email for Updates