SpeedyAlert is a free tool that sends you an email notification if a running application crashed, stalled or is short on RAM & other critical resources. This is a very useful tool for PC’s hosting 24/7 automated strategies. Avoid these not so funny “surprises” & download SpeedyAlert today!
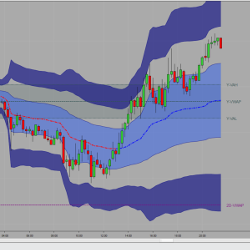
Predict the ultimate stop level using the sophisticated NSR Triple STX, which performs over a million calculations per bar. Measure the trend strength using the non-arbitrary Ocean math with the BTX indicators. Includes Ocean Classic. Sign up for a 30 day free trial!
The Volume Weighted Average Price (VWAP) tells traders the average price for all transactions executed during a trading session, such as the current day, week, month or quarter. Many institutional traders execute based on the VWAP, so it is an important price benchmark to control transaction costs.
More Tech, LLC has over 10 years of experience working with MetaTrader, and have converted hundreds of indicators and strategies to be compatible with the NinjaTrader platform. Contact them today to receive a free estimate for having your code converted from MQL to NinjaScript.
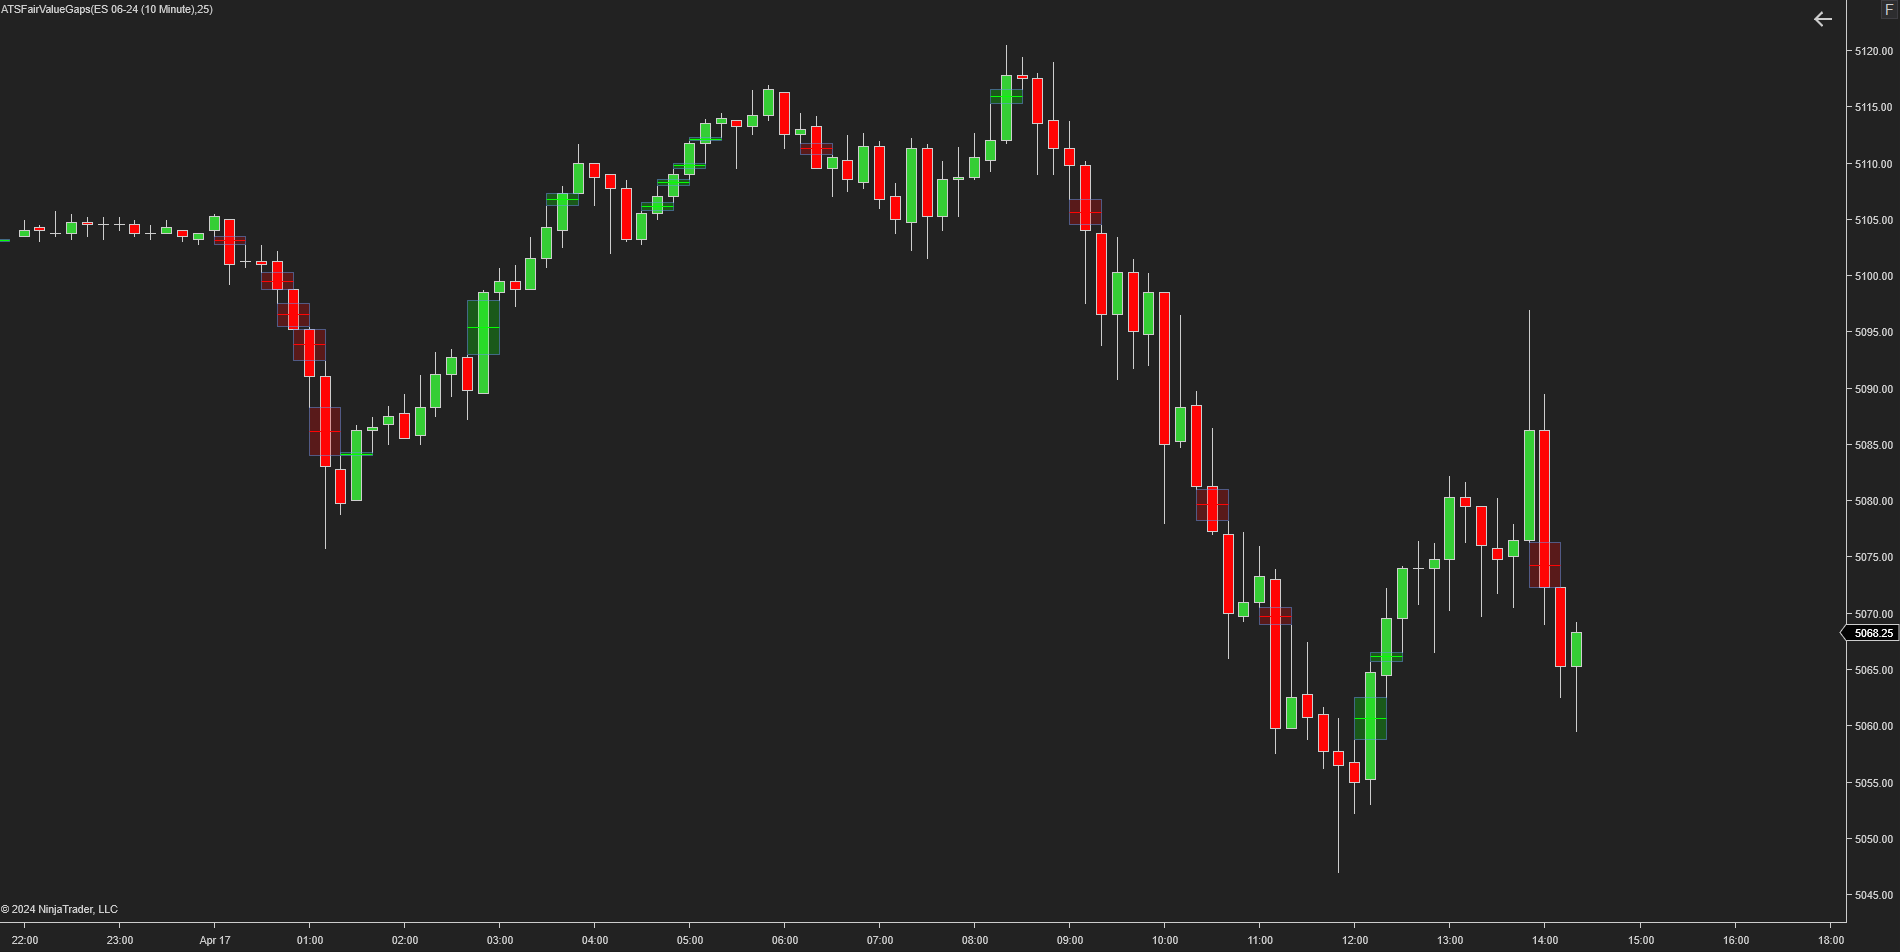
This indicator will plot the imbalances in the market. These imbalances are commonly known as Fair Value Gaps.
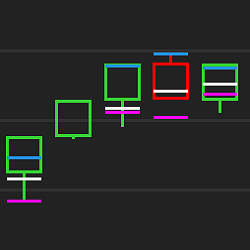
Are you using Renko/range/tick/volume bars? Optimal Tempo shows you the high/low/close of time-period bars overlaid on your chart. Choose any time period you wish. See five-minute bar levels overlaid on a Renko chart! No need to watch other charts. Strategy compatible.
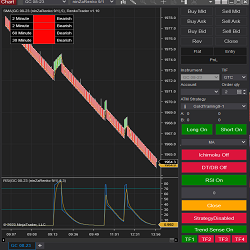
BurstAlgo is a straightforward and efficient automated trading tool designed to trade prop-firm accounts. It's built to preform up to three trades daily, focusing on consistent trading. This algorithm is all about keeping things practical.
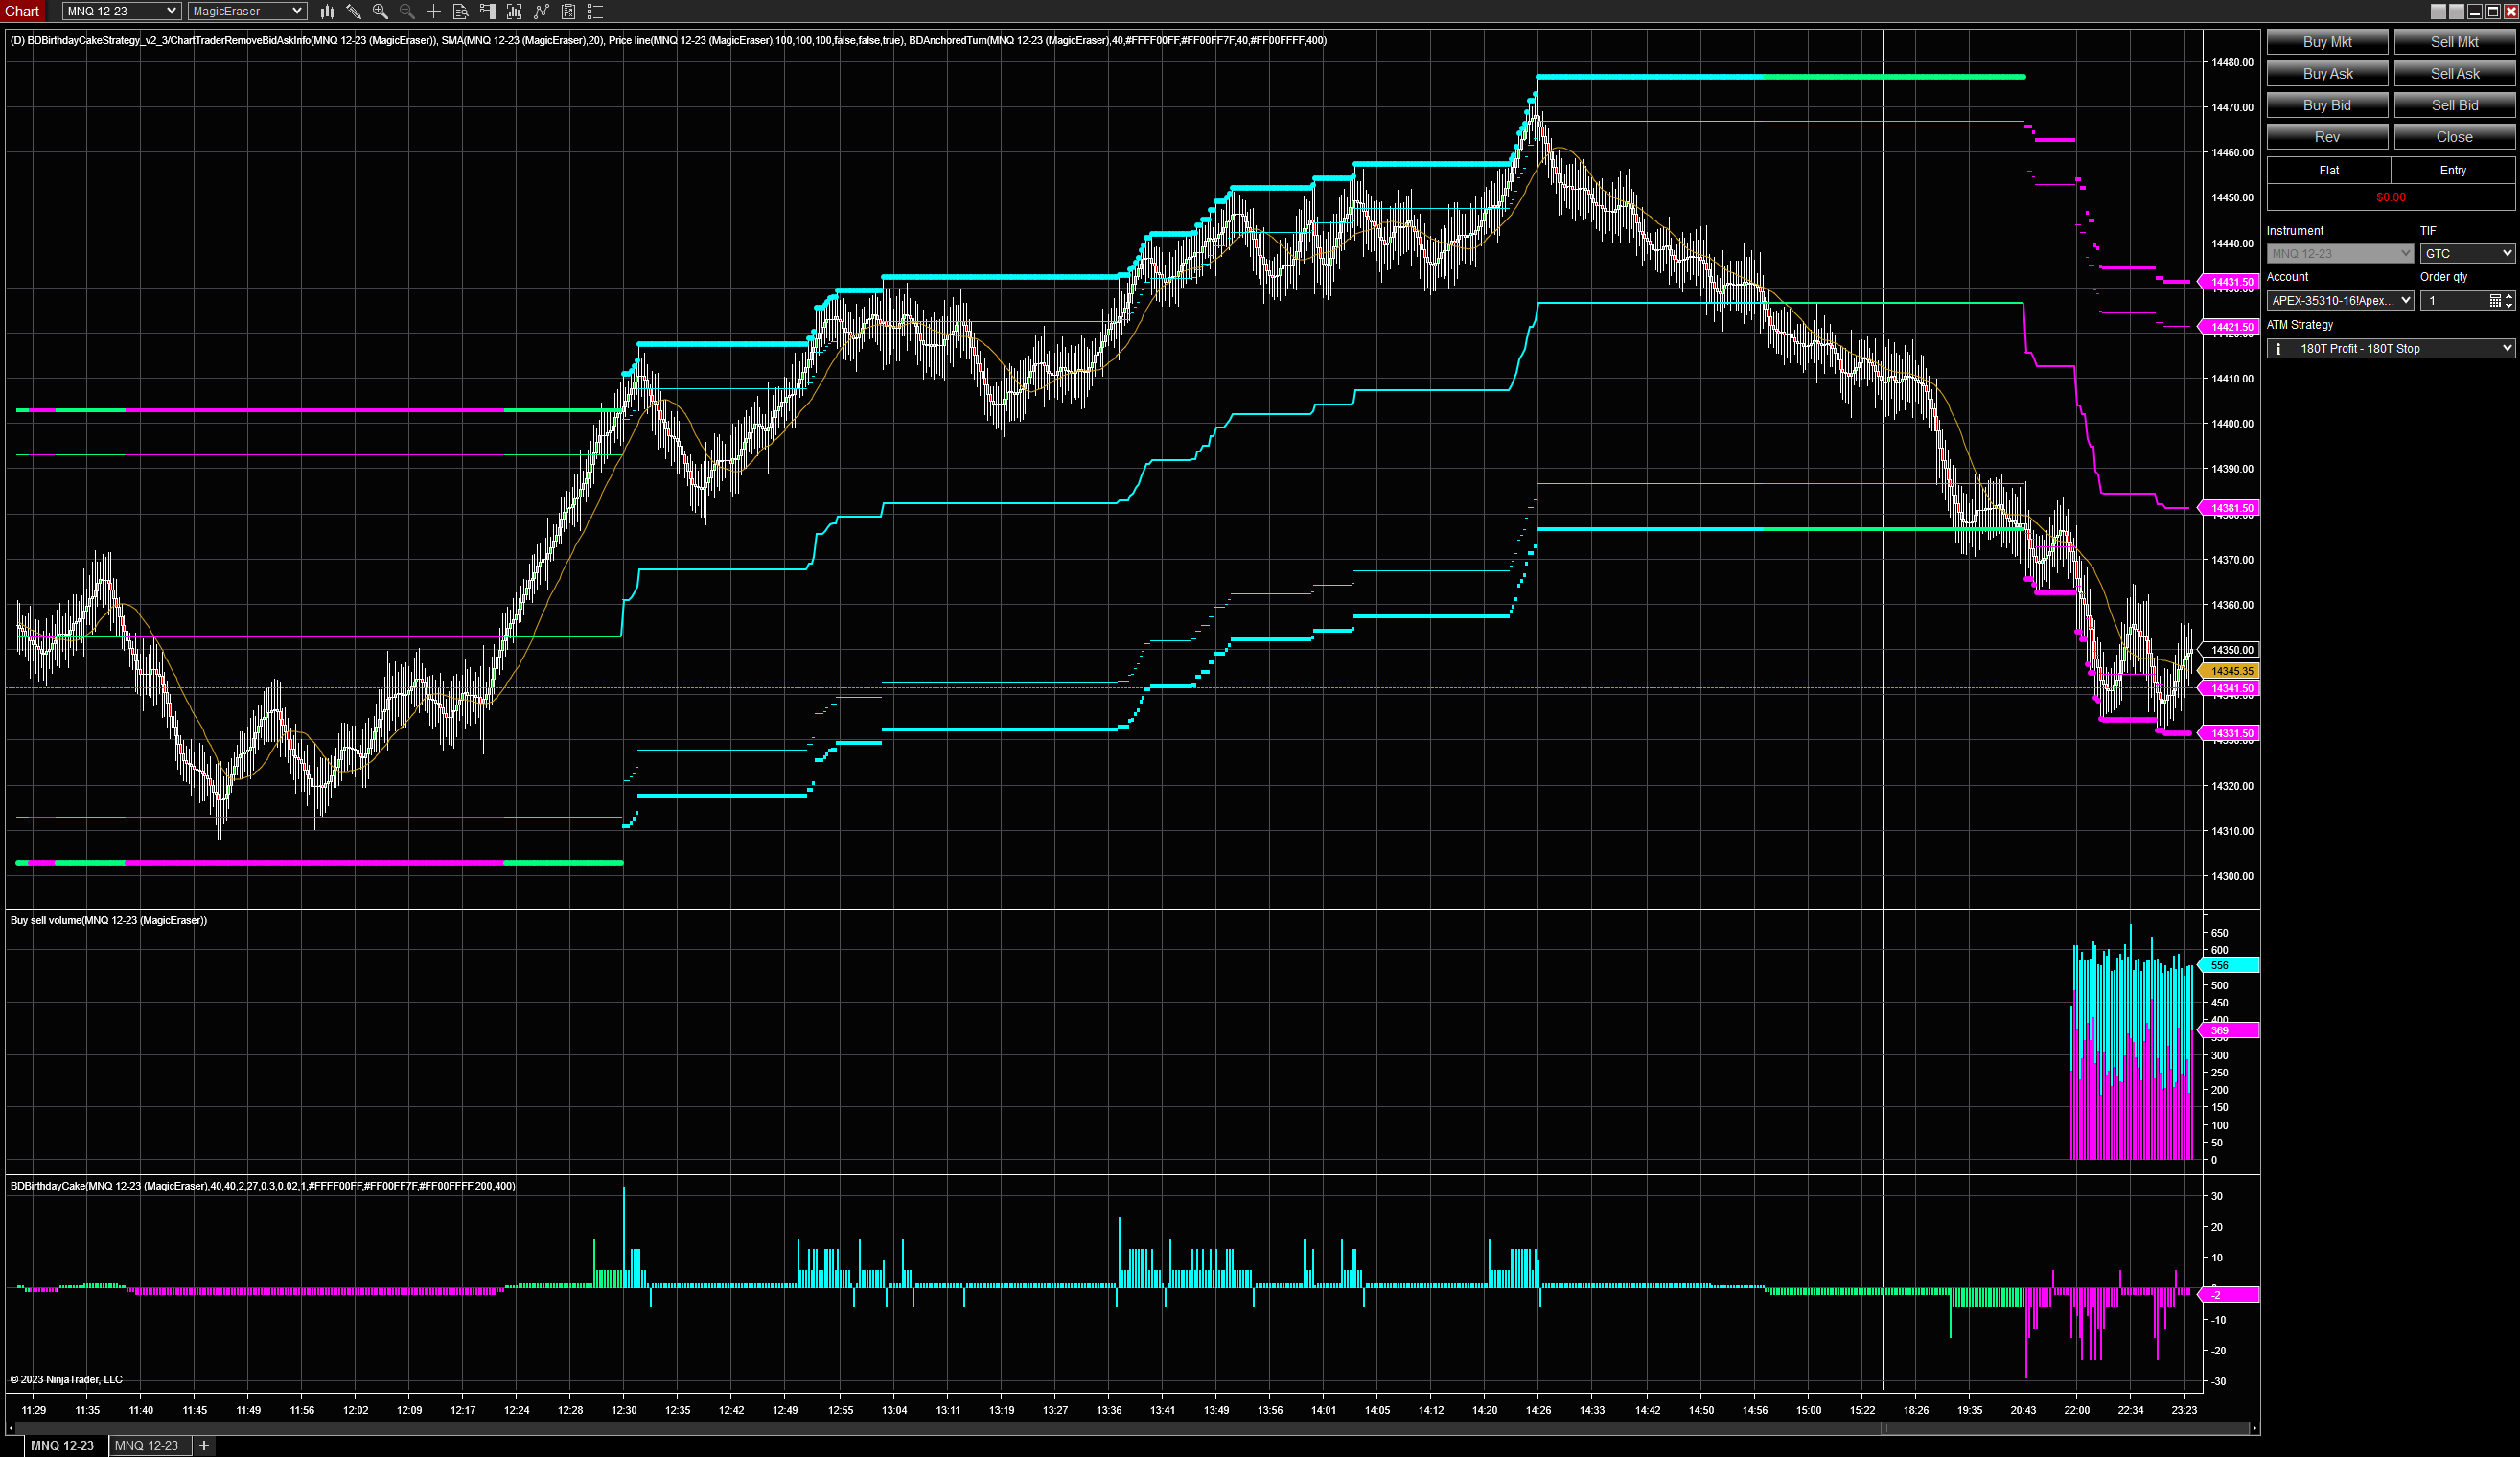
These bars reduce the number of reported crosses at a specific price due to wide spreads and fast DOM action. If your strategies require entries at a specific price you will find that these bars reduce the whipsaws in tick based bars.
Renko Trader is an Indicator Tool that allows you to create algorithm strategies using multiple time frames, moving averages, rsi, renko charts and ichimoku cloud. You will be able to customize your strategies using various parameters. Includes dynamic interface to turn strategy on and off.
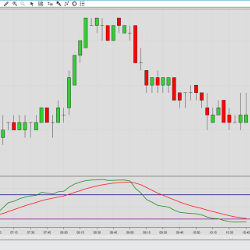
The Slow Relative Strength Index is an adaptation of the classic RSI calculation, customized for use in higher timeframes. The slow RSI calculation compares the close price with an exponential moving average instead of the previous value.
December 2, 2024
Mastering Sideways Markets With Auction Bars and Range Projections
November 19, 2024
Enhancing Your Automated Trading System: Key Insights from Best Pro Trade
November 14, 2024
NinjaTrader New Ecosystem Tools: October 2024 Edition
Enter Email for Updates