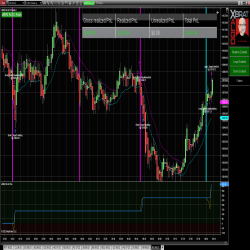
xBrad Auto Trader is an automated trading algorithm for futures trading across all sectors! Indexes, energy, metals and bonds. Each instrument has been taken through a machine learning architect software and can be optimized on your trading platform for the subscribed auto trader!
The ribbon-like indicator, Fantastic MA Ribbon, is created by plotting multiple moving averages (MA) with varying lengths. It incorporates four signal mechanisms, offering diverse options to align with your unique trading style.
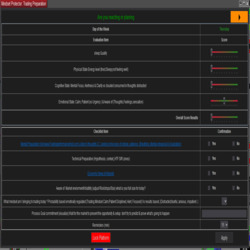
Fully customizable platform-integrated Trading Performance Toolkit that includes daily session preparation and mindset window, trade evaluation window, trader break reminder window, journal, emotional pattern and habit tracker, daily score card and performance stats window, account risk management.
Fully-automated. The VMX selects a time of day to trade during the cash session for stock index futures. This system takes advantage of the volatility created by big institutions moving asset allocations in the equity markets. All positions closed before the end of the cash session.
AITrendPredictor™ predicts price direction movement for the next 24 hours based on an advanced AI model, and for each prediction it provides an accuracy percentage score. It works in conjunction with DataGrabber™, which is used to generate data that gets used in AITrendPredictor™.
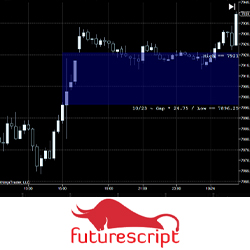
The Gap indicator was designed to illustrate when dramatic price disconnects from one period to the next when the market establishes critical levels. This indicator has been carefully constructed to explore different perspectives and trading approaches related to the gap in intuitive ways.
CommoditySignal is an essential trading signal app for commodity traders, offering precise signals for Crude Oil, Natural Gas, Gold, and Silver. Experience a 3-day free trial to see its effectiveness firsthand. Available on both iOS and Android, CommoditySignal delivers timely insights.
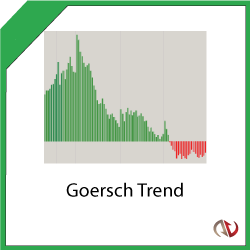
Confirm trend direction with this unique & proprietary indicator. It can be combined with any trading strategy to provide extra confirmation & is ideal for validating your open trades. It works out-of-the-box with no parametrization needed & detects Up and Down trends.
Semi-auto trading tool used to help enter and manage trades when using Renko style charts. Customize entry condition, stops, targets, breakeven and trail.
Try our fully-functional, ready-to-use automated trading strategy for NinjaTrader 8 at no cost for 14 days. Designed for the futures market, it has been thoroughly backtested, needs no adjustments, & is suitable for Micro/Mini markets. Full support and templates are included during your free trial.
December 2, 2024
Mastering Sideways Markets With Auction Bars and Range Projections
November 19, 2024
Enhancing Your Automated Trading System: Key Insights from Best Pro Trade
November 14, 2024
NinjaTrader New Ecosystem Tools: October 2024 Edition
Enter Email for Updates