Our intelligent and powerful automated strategies let you rule the markets like a pro. Algos are available for most popular futures markets and are ready to go out of the box. Our strategies are NinjaTrader 7 & NinjaTrader 8 compatible to take your trading to the next level.
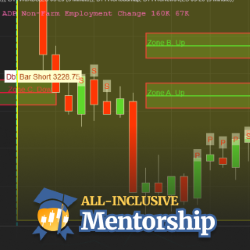
Become a pro trader via an eight-week trading school. All courses & software are included. Receive live training from a coach who teaches you over 10 price action methods & how they work together to form a complete plan for daily trading. Learn the exclusive Roadmap & Blueprint techniques.
Curious about NinjaTrader 8's supplied indicators, or seeking detailed information about them? Follow this link for an in-depth exploration of each indicator, providing you with the knowledge you need for effective trading. Dive into comprehensive insights now!
According to your technical plan, Advanced Software Features will implement a trading idea or an indicator idea using the C# computer code and the NinjaTrader 8 terminal. With the help of additional mathematical libraries, they will be able to develop complex trading algorithms with you.
The Visualized Trader helps make trade signals easy to see by measuring 5 uncorrelated energies of money flow. When they are all bullish or all bearish at the same time it plots a simple red or green box on your chart, eliminating the need to clutter your chart with a lot of indicators.
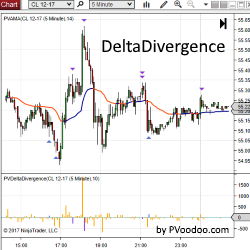
PVDeltaDivergence Indicator is a powerful tool designed to help traders identify possible turning points in their favorite markets with order flow analysis. Get a free trial of PVDeltaDivergence for NinjaTrader today!
TradeDevils Indicators offers unique indicators for NinjaTrader 8. Regardless of whether you are a scalper, a trend follower or a breakout trader, they can provide you with the right indicators to assist with your trading.
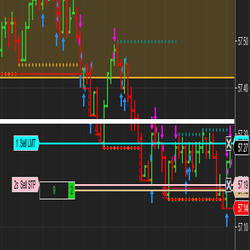
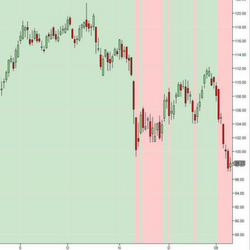
View stops and targets on your screen based on the ever-changing average true range.
The TSR Indicator Pack is designed to help you focus on price action. Find price action patterns like Pin Bar, Inside Day, and Hikkake with ease. With it, you can also paint your chart background according to the slope of any indicator. Never lose track of price action again. Pay what you want!
The Min Pack is a starter package featuring IndicatorSmart’s most popular, important and advanced trading tools. This minimum powerhouse tool kit has the most basic, minimum components that show you the minimum of what you cannot see just by looking at an ordinary chart.
December 2, 2024
Mastering Sideways Markets With Auction Bars and Range Projections
November 19, 2024
Enhancing Your Automated Trading System: Key Insights from Best Pro Trade
November 14, 2024
NinjaTrader New Ecosystem Tools: October 2024 Edition
Enter Email for Updates