Enhanced Decision-Making; Trading Awareness/Behavior. Basic Training accelerates improvement by strengthening behaviors causing the brain to filter, process, and apply information most effectively. Psychology, sociology and neuroscience are integrated to keep decisions ahead of price movement.
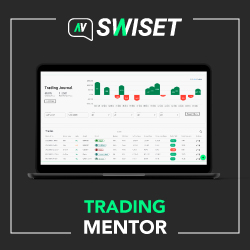
Trading Mentor is an automatic system based on data science which helps traders understand the most important insights of their trading and adjust their trading strategies for consistent results.
The ability to change colors of a line based on preset angles is revolutionary! Select any up/down trigger angle, any up/down release angle, and receive color changes and alert sounds. Lines stay a triggered color until the release angle is reached. The line then reverts to neutral.
An automated strategy scalping method that searches for entry conditions at the extreme areas of the market. As price approaches the everchanging highs & lows during the trading session, the ABL will look for the various internal market requirements that it considers applicable for market entries.
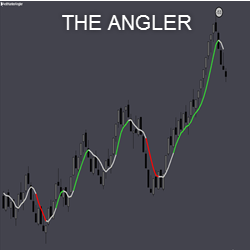
Price Action Harvester™ scans all markets to find consistent price action patterns based on historical data. Know how price moved for any instrument on particular days, during particular time-frames. A powerful tool for day traders. Don't miss this indicator!
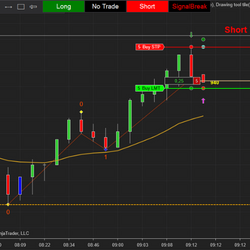
Trade two-legged pullback with this Second Entry Indicator! This is a semi-automated, two-legged pullback strategy using the built-in trading-buttons. Get alerts and your orders are placed automatically at the correct spot (no more dragging orders).
Discover our daily trading and investment newsletter service provided by the #1 Market Timer of 2018 as ranked by Timer Digest.
Connect to a remote desktop from work, home or business trips. Monitor your trades from any location. Your automated trading strategies can run 24/7, without the risk of the computer shutting down. 1 GB/S, low latency, Intel Xeon, USA located, 24/7 access.
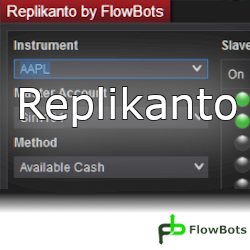
This is an order replication add-on between accounts. It replicates orders from a Leader Account to multiple follower accounts according to the replication method selected. There are several replication methods, each with its own functionality. It replicates orders in both NinjaTrader 7 & 8.
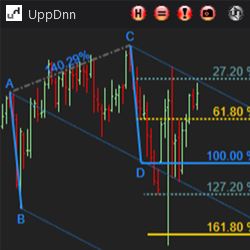
The Symmetry Drawing Tool helps quickly analyze symmetrical market movements by simply drawing a line from point A to point C. Add Fibonacci levels, customize appearance, add Andrew's Pitchfork with customizable levels and output a potential reversal area based on swing pattern logic!
December 2, 2024
Mastering Sideways Markets With Auction Bars and Range Projections
November 19, 2024
Enhancing Your Automated Trading System: Key Insights from Best Pro Trade
November 14, 2024
NinjaTrader New Ecosystem Tools: October 2024 Edition
Enter Email for Updates