Get precious info to prepare for the trading session! Focused 100% in E-mini S&P500 Futures, Pre-Market Studies daily presents possible scenarios for the session, highlighting important regions based in a mix of technical analysis with order flow tools. Get started now with a FREE 15-day trial.
Clicker allows one to enter orders with one click directly on the chart! Modifier keys and mouse buttons for buying and selling are configurable. The order type is detected from the clicked price relative to the market price. All order parameters come from ChartTrader. Free trial for seven days.
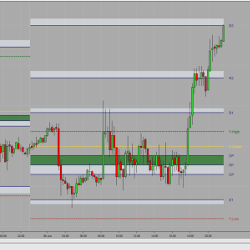
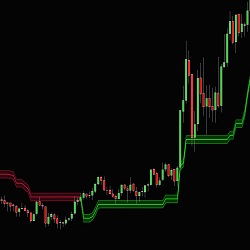
Session Pivots are a well known trading technique to calculate intraday support and resistance points. Because of its simplicity and efficiency, it is still a very reliable method for determining key support and resistance levels.
Become a pro trader with our 26 chapter Price Action Trading Course. Step by step guides showing you how to find signals, set up your chart,find trends,when & when not to trade & much more. Includes lifetime membership,live daily analysis,chatroom & weekly analysis video sent directly to your inbox.
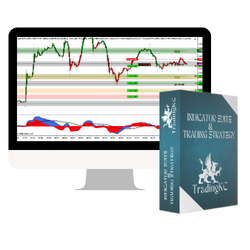
Simplify your trading with my strategy: trend, price action, support/resistance and momentum. Green/red bars indicate trend, custom ExCon indicator manages setups, pivots show support/resistance and MACD ties it all together. Clear entries, take profits and exits with simple rules for engagement.
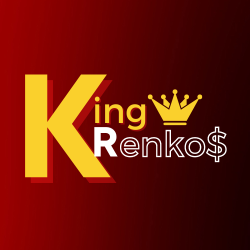
KingRenko$ is the real “face” of ninZaRenko. It has no artificial open and only real data, so you can see for sure the real OHLC of a KingRenko$ candle. As a result, KingRenko$ can be accurately backtested.
Introducing Friend Zone, a professional market indicator designed to identify mean reversion opportunities with precision. By analyzing price movements and historical data, Friend Zone intelligently detects when a security has deviated significantly from its average value.
This incredibly innovative suite of Bollinger Bands and divergence indicators shows selected, plotted ‘dots’ with a broad selection of Bollinger Band combinations. You can choose from seven indicator combinations!
Become a full access member to all of thei exciting services. Membership includes: Trade room access, software activation for up two computers, and thei Daily Market Movers trade reports.
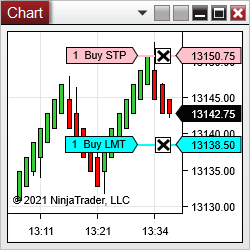
Looking for a great method for order entry or account/strategy management on NinjaTrader? Tyche Trading’s indicator gives you the ability to enter into trades with a click. You can use multiple instances of the indicator to trade with multiple accounts and/or strategies. Get a free trial today!
March 25, 2024
Trading Pullbacks and Reversals: Simplifying a Once Complex Retail Trading Strategy
March 21, 2024
VWAP Indicator: Average Price Shown Based on Price, Volume
March 18, 2024
Trade Copier Strategies: Make Efficiency Work for You When Futures Trading
Enter Email for Updates