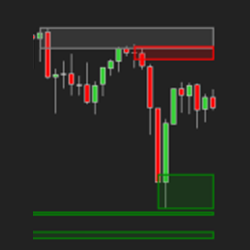
Q-PZone provides visual naked volume point of control (VPOC) zones. These VPOC zone levels are significant because they can act as a support or resistance level.
The algorithm works by continuously processing live data such as time & sales, volume, tape pace and tape acceleration. The algorithm performs real-time analyses, dynamically adapting to identify aggressive buyers and sellers actively influencing the market.
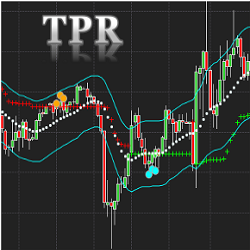
The Trend Pullback Reversal (TPR) Indicator displays possible price trends with pullback and reversal signals. TPR will focus on the main trend and filter out most minor price movements. The NinjaTrader 8 version comes with a unique band and center line as additional features.
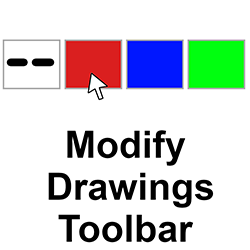
Trying to change line types and colors requires opening the properties box. It's also tricky to set a line or ray to be exactly horizontal. This toolbar contains various tools to help with those frequent property changes. It will even move your object endpoint to the chart's end.
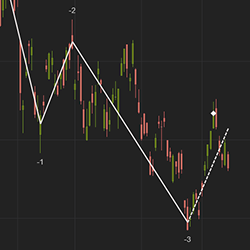
The Wave indicator is similar to an Elliot Wave with an added capability to forecast a possible market reversal. It has convenient features including the ability to number waves to help identify trend direction.
The BuySide Global Auto Trader is a state of the art automated trading system monitoring software recognition of Institutional Buy and Sell programs. The system is universal and will work in any liquid market and many timeframes. Learn more!
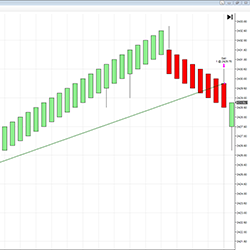
DTB River is an implementation of DTB Waves on non-time based charts and the results are plotted on time-based charts. It provides an added layer of noise filtering for waves. During the consolidation phase DTB River flattens out.
Elevated trading with precision and autonomy. Trade smarter, hands-free! Does not activate everyday as it is looking for specific market opportunities.
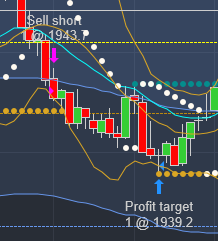
ThunderZilla is a user-friendly trading system designed to enhance your pullback trading. It integrates essential features for a well-rounded approach, including trend identification, entry signals, stop placements, targets, and trailing stops.
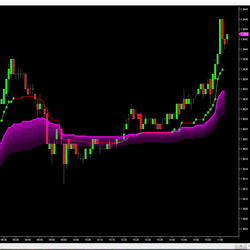
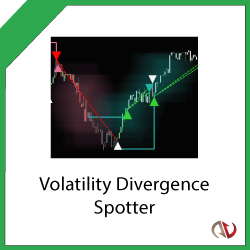
Spot the calm before the storm for both breakouts and breakdowns with this ultimate volatility indicator! Spot bullish accumulation and consolidation points before strong upward breakouts and continued bullish trends. Find points of failing strength at plateaus and tops before drops.
December 2, 2024
Mastering Sideways Markets With Auction Bars and Range Projections
November 19, 2024
Enhancing Your Automated Trading System: Key Insights from Best Pro Trade
November 14, 2024
NinjaTrader New Ecosystem Tools: October 2024 Edition
Enter Email for Updates