This strategy uses a collection of moving average and oscillator indicators to identify trends in the market. The use of limit orders for entry and exit orders get's you the best price possible when buying or selling. This strategy uses both long trades and short trades.
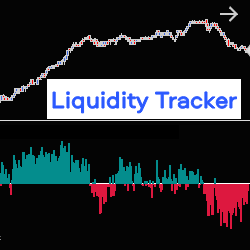
The Liquidity Tracker allows you to monitor, in real time, liquidity variations in the Order Book (pending orders at Bid & Ask), on one or two correlated instruments, at the same time. It therefore allows you to follow the evolution of the market based on the strength of supply or demand.
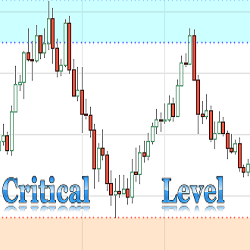
The purpose of this indicator is to automatically plot critical support and resistance levels on a chart. The Critical Support & Resistance Level Indicator comes with customizable alerts and can be added as a Market Analyzer column.
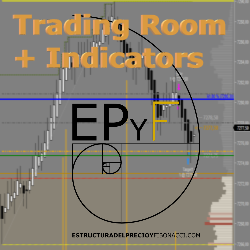
The EPyF Trading Room is made up of a team of traders focused on the study, analysis & trading of the futures market with the EPyF System. Inside you´ll learn, share and grow with a group of traders who have the same vision & philosophy of the market. Join and get access to our chat and indicators!
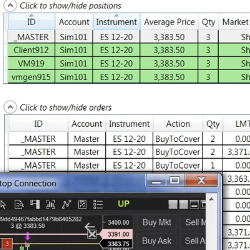
Replicate orders and manage positions from a master NinjaTrader instance to one or multiple NinjaTrader slaves.
BookMap helps traders detect better support and resistance levels by plotting order book data directly on the chart. Through market depth behind price bars, order flow traders can watch the limit order book unfold in real time, highlighting significant price levels such as support and resistance.
You can now calculate how liquid a symbol is based on its trading activity and filter out risky instruments. A higher no of trades a day would mean that the instrument is drawing attention. Start using this powerful screener tool in your market analyzer today!
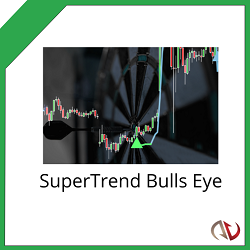
The world’s first self-optimizing SuperTrend indicator. It uses spearhead third-generation scanning to identify actionable signals. Performance metrics like profit factor and number of winners are displayed on the chart to determine potential results.
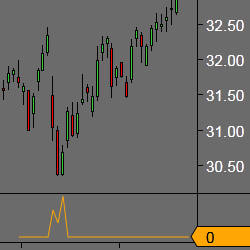
Precision Divergence Finder is designed to find bullish divergences in Demand Index readings in real time with no delay or re-painting. It can often pinpoint precise market bottoms and using this product can give you the insight needed to increase the chances of finding the exact market low point.
By marking the high and low range from 8-9 AM and extending these levels along with the midpoint throughout the session, this indicator provides insights into market dynamics right after the open. Traders can use this information to strategize around the rejection or acceptance of these levels.
December 2, 2024
Mastering Sideways Markets With Auction Bars and Range Projections
November 19, 2024
Enhancing Your Automated Trading System: Key Insights from Best Pro Trade
November 14, 2024
NinjaTrader New Ecosystem Tools: October 2024 Edition
Enter Email for Updates