Pinnacle Quant offers custom, confidential NinjaScript programming and consulting services. Our services are offered for serious traders, CTAs, and hedge funds. Take advantage of our 20+ years of development and trading expertise. One-on-one consulting is available.
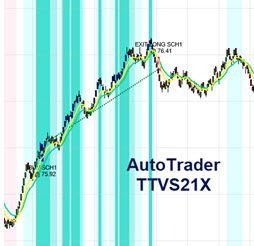
Comprehensive automated system, including 20 strategies, covering a broad range of instruments and market conditions. Includes indicators, color backgrounds and a powerful money management module to protect profit and principal. Lease includes training and support.
Upgrade to the silver plan for enhanced trading capabilities. Get all the features of the bronze plan plus the reference synchronizer module. The reference synchronizer indicator ensures seamless data flow between different charts, including market profile, daily, weekly and monthly charts.
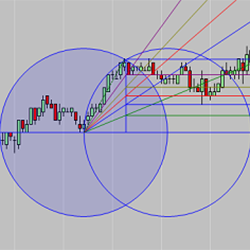
Attention Fibonacci, support/resistance, Gann & market structure enthusiasts! The HarmonicFan draws an A-B line & 2 intersecting arcs are calculated. The upper or lower half of the resulting Vesica Piscis formation is then divided into Fib levels & trend lines are then created as a fan. Learn More!
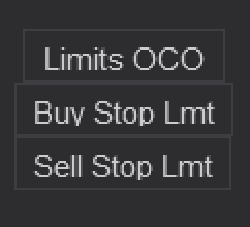
Bars Edge Trader Button and OCO Timer pack for NinjaTrader 8. An easy fast solution to apply Limit Orders to your Chart Trader. Included are three timers for adding OCO Limits entries throughout the day to catch a news cycles semi-automatically.
Highly sought after day trading strategy and methods course. Featuring the successful "Ultimate 25Bar, Ultimate Backdoor, and Ultimate Slingshot" systems. Complete with over 65 videos and more. Over 13 years strong. Includes access to our Ultimate Scalper group chat and text support.
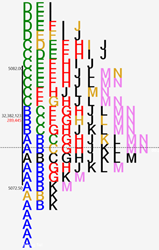
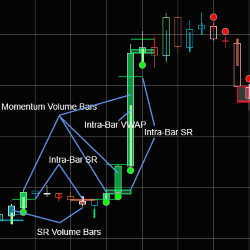
Every bar contains information. You miss a lot of valuable information due to filtering bars by time, variance or some other method. The best solution is to allow these bars to provide you with all the valuable and needed information in a compact and informative manner.
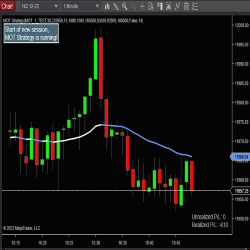
MightyOxTrading Strategy is an automated trading strategy for NinjaTrader 8. It has the option to use higher-timeframe bars as a filter for potential trades. It uses an ATM strategy for order management, so you can configure it for a single contract or for multiple contracts using a "runner".
QuantVPS provides ultra fast, reliable, and secure virtual private servers optimized for algorithmic trading. With instant setup and 24/7 support, their servers ensure your trading systems run efficiently, reducing latency and ensuring uptime. Optimize your execution with QuantVPS.com.
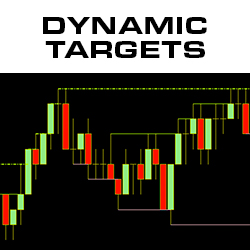
The Dynamic Targets indicator draws real-time lines at price points which serve as support and resistance, as well as entry, exit and stop adjustment targets. The data boxes provide key information to determine the relative strength of each support/resistance line. Download Dynamic Targets Today!
December 2, 2024
Mastering Sideways Markets With Auction Bars and Range Projections
November 19, 2024
Enhancing Your Automated Trading System: Key Insights from Best Pro Trade
November 14, 2024
NinjaTrader New Ecosystem Tools: October 2024 Edition
Enter Email for Updates