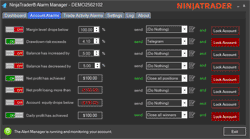
The NinjaTrader Risk Manager is a personal trading assistant for your PC, designed to perform various automated tasks. These include setting alarms for account and trade activities, initiating account lock-outs, and alerting you when your account is at risk.
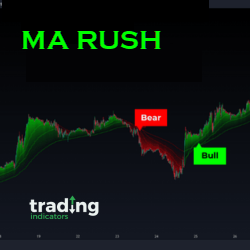
MA Rush is a trend-following indicator that provides intelligent multi-time frame analysis, adapting to different trading time frames. It predicts potential strong market trends, either uptrends or downtrends.
You can now calculate how liquid a symbol is based on its trading activity and filter out risky instruments. A higher no of trades a day would mean that the instrument is drawing attention. Start using this powerful screener tool in your market analyzer today!
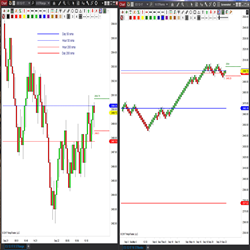
The STMA indicator offers traders the ability to auto plot higher timeframe Simple or Exponential Moving Average’s on smaller time framed charts. Learn More about the STMA!
The Tradesight Plus Subscription includes access to their live Trading Lab, a suite of ten NinjaTrader add-on tools, plus all their stocks, futures, Forex, and options calls throughout the day. The subscription also includes the Tradesight Forex and Futures Levels.
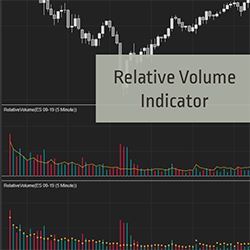
Detect unusual or below average volume easily. Identify the start or end of a move with no effort. Relative Volume (RVOL) compares current volume to the average volume for the same time of day. Start your 2-week trial now!
Our custom indicators include automated plotting of trend wave counts, cycles (timing for entries and exits), momentum strength, support & resistance, divergence patterns and some Japanese candlestick patterns.
Forecast oncoming trading patterns! Trade Forecaster tells you what price action to expect, allowing you to properly prepare your strategy in advance. It will alert you to oncoming scalp, swing or trend trading conditions. See a video of Trade Forecaster in action!
Toni Hansen’s most popular online trading course is now available as a boot camp! Originally developed by Toni in the late 90s, her straightforward trading methodology has withstood the test of time.
Build, test & trade automated or discretionary systems in Futures, Forex & Equity markets. Generate concise trade signals while incorporating top day trading indicators. For example, use simple solvers to easily incorporate Fibonacci retracements from leading indicators. Start your free trial now!
December 2, 2024
Mastering Sideways Markets With Auction Bars and Range Projections
November 19, 2024
Enhancing Your Automated Trading System: Key Insights from Best Pro Trade
November 14, 2024
NinjaTrader New Ecosystem Tools: October 2024 Edition
Enter Email for Updates