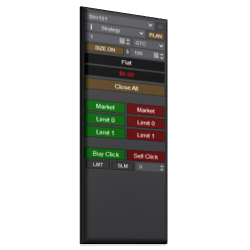
The Essential Chart Trader Tools is a starter pack for the Enhanced Chart Trader. It is full of features to help traders focus on decision making, remove stress and minimize mistakes. The Essential Chart Trader Tools can be added to any chart window in NinjaTrader.
Automated Trading Strategy for the MNQ based on user inputted times.
The BuySide Global Auto Trader is a state of the art automated trading system monitoring software recognition of Institutional Buy and Sell programs. The system is universal and will work in any liquid market and many timeframes. Learn more!
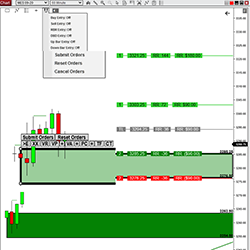
PFAHedger is an innovative addon to the PFAZoneSuite supply & demand indicator, providing the ability to submit hedging positions on any market. Simultaneously submit trades on any market while submitting hedge orders on another market, directly from the same chart.
Speeding Trading Servers offers high performance co-located virtual & dedicated servers (VPS) for professional & retail traders. Optimize fills, reduce slippage & run automated trading strategies 24/7 from any location. Sign up for a free one week trial today!
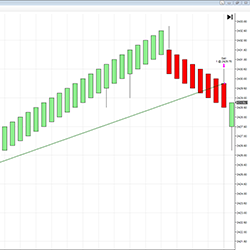
Dynamic Volume Profile is an optimized indicator which represents market profile with live and historical volume data. This strategy and backtest friendly indicator enables users to easily analyze years of historical data and adjust parameters dynamically from both the menu and chart.
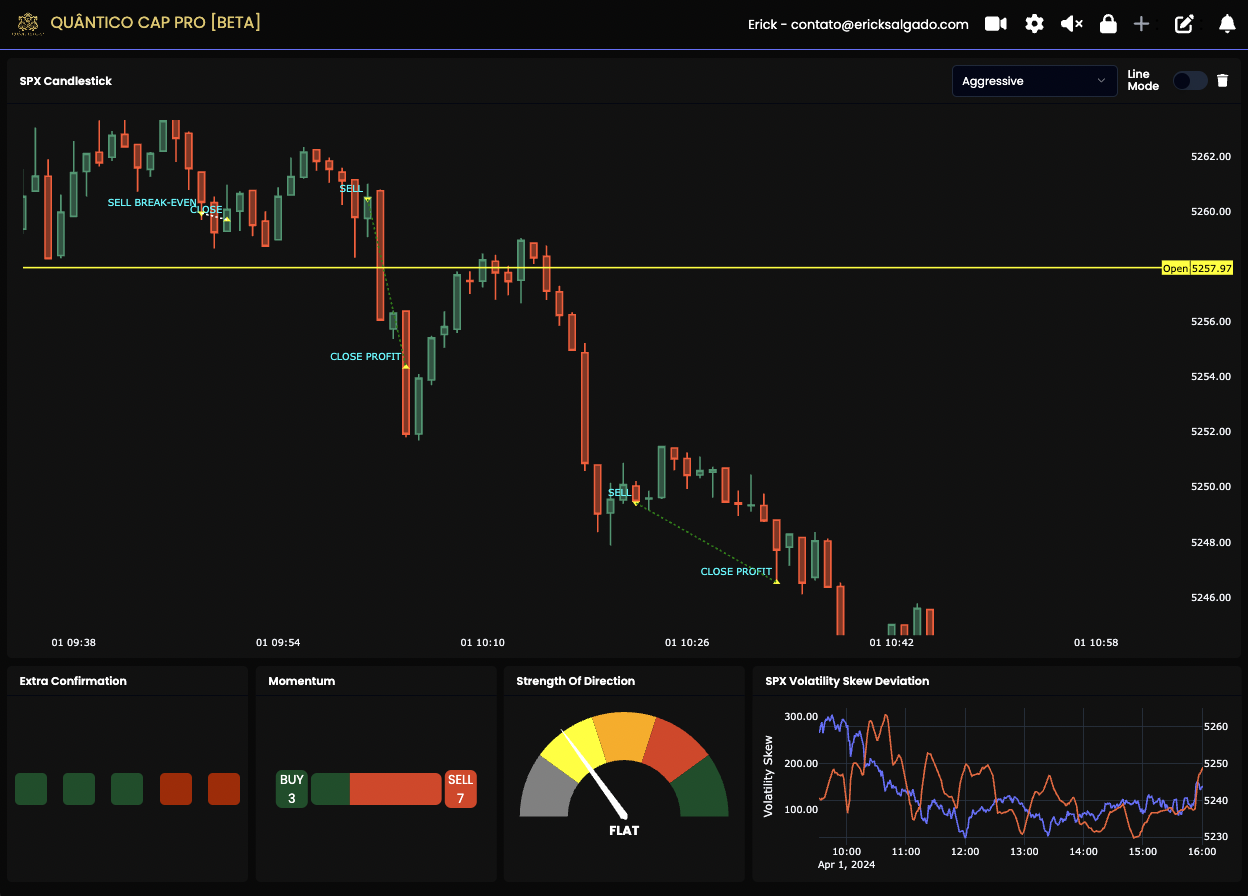
Access clear buy and sell signals tailored for trading precisely when our algorithm detects market maker interventions. Exclusively offered for ES and NQ, seize the opportunity to join our community of hundreds of traders already leveraging 0DTE and Market Maker setups.
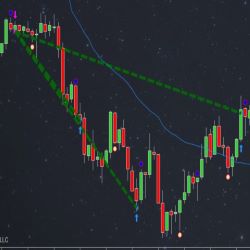
Download a 14-day test period of this trading indicator that identifies points to enter the market for price pullbacks and reversals. The indicator uses pure price action, which makes it possible to get rid of lagging indicators. Be independent of the values and stage of the market.
SpeedyAlert is a free tool that sends you an email notification if a running application crashed, stalled or is short on RAM & other critical resources. This is a very useful tool for PC’s hosting 24/7 automated strategies. Avoid these not so funny “surprises” & download SpeedyAlert today!
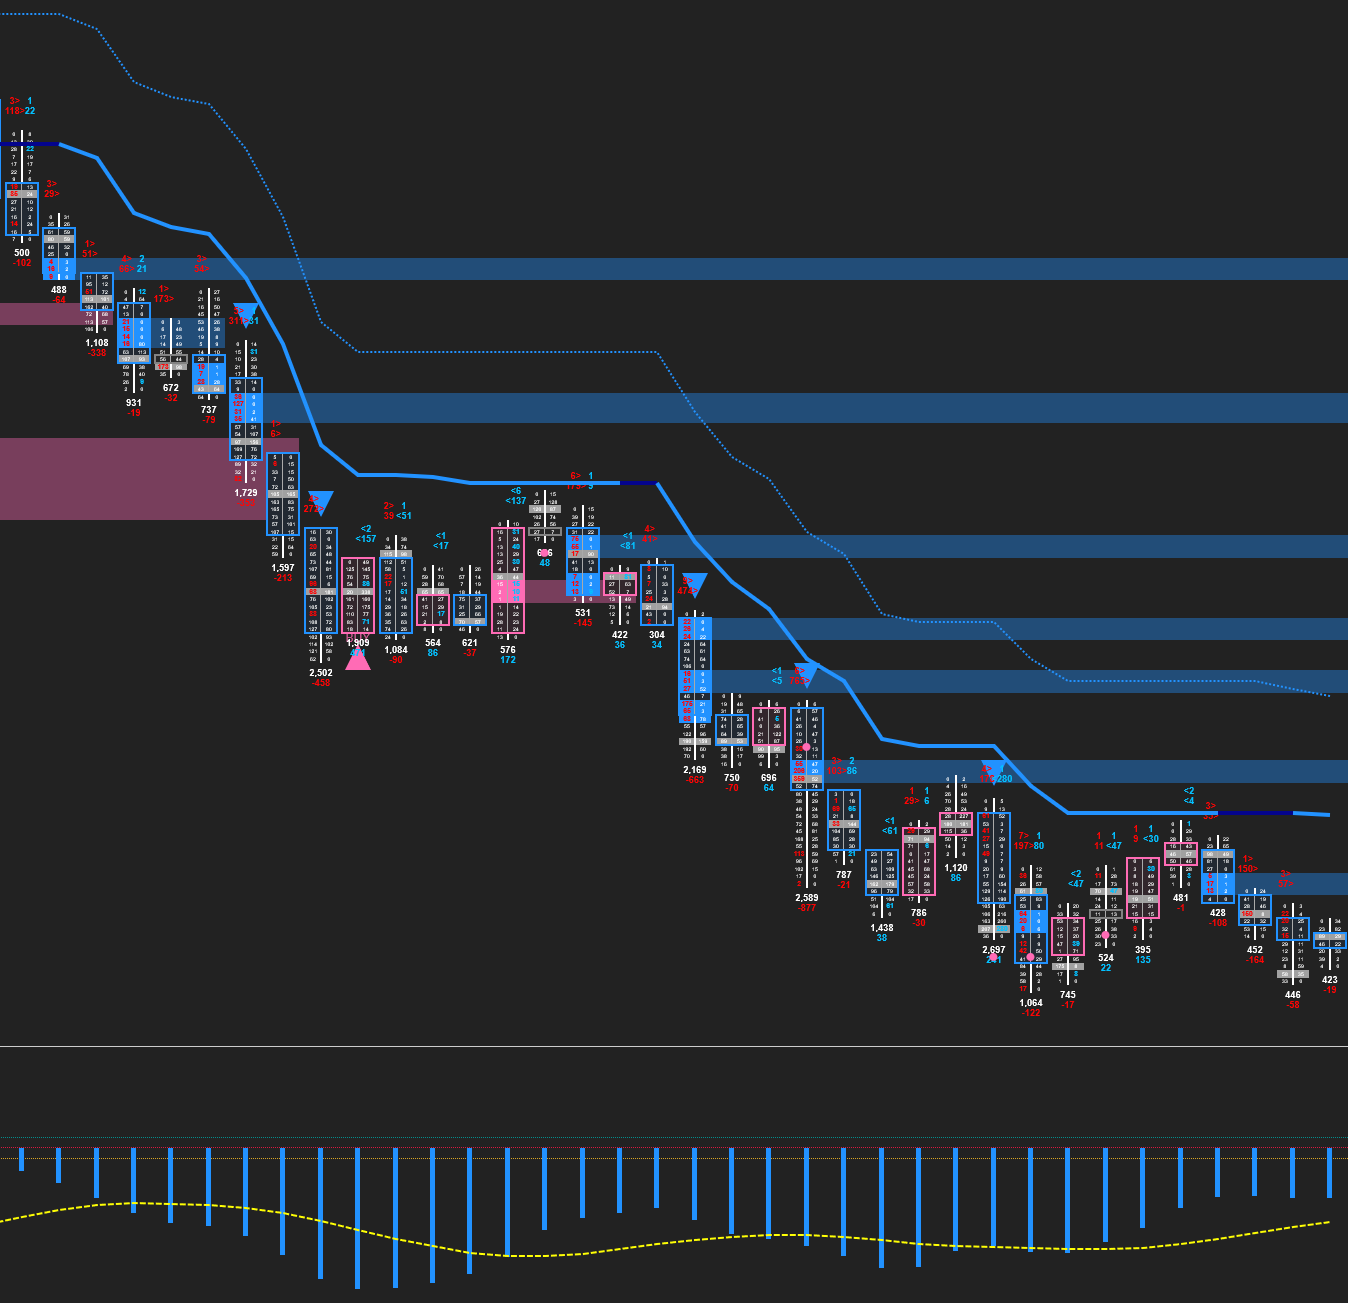
China Market Data, Order Flow
December 2, 2024
Mastering Sideways Markets With Auction Bars and Range Projections
November 19, 2024
Enhancing Your Automated Trading System: Key Insights from Best Pro Trade
November 14, 2024
NinjaTrader New Ecosystem Tools: October 2024 Edition
Enter Email for Updates