Take advantage of IndicatorSmart’s special discounts for NinjaTrader Ecosystem users. Be sure to sign up for their Members List on their site for even more special offers and to stay informed about important trader events.
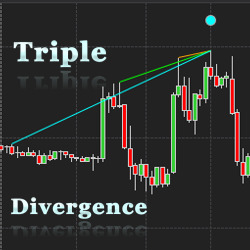
When three continuous divergences occur the WilliamsR Triple Divergence Indicator will trigger an entry signal at the current bar. This indicator integrates with NinjaTrader’s market analyzer and indicates either bullish or bearish divergence at x number of bars ago.
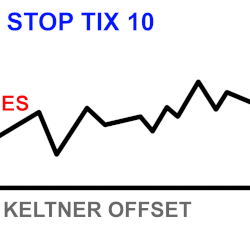
Stop Keltner uses Keltner Band distance to help give an estimated stop-loss in ticks, which is displayed in an easy-to-read text box on the chart. It’s also an excellent backtesting tool for getting estimated stops when identifying past trade entries on historical bars. Built for ES momentum traders
TD Order Flow features Heavy Volume Zones, multiple Volume Nodes, Imbalances, Unfinished Business, a built-in Trades Filter and a separate Cumulative Delta indicator as a bonus. It works with both futures and forex and includes 12 hours of Order Flow video training.
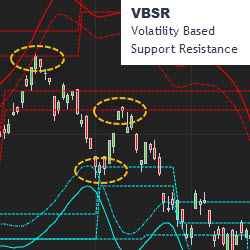
MetaSwing plots the hidden structure of support and resistance in real-time. VBSR (volatility based support resistance) makes this visible in advance, in all timeframes. Markets are non-linear and your tools should be as well. It’s not your father’s TA. Trial MetaSwing.
Master back-testing in algorithmic and quant trading with their dual course bundle. Learn essential techniques and advanced methods to optimize your trading strategies. Validate and optimize your trades with systematic, quantitative approaches. Start building your trading edge today! Sign up now!
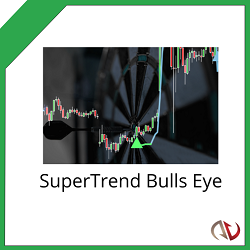
The world’s first self-optimizing SuperTrend indicator. It uses spearhead third-generation scanning to identify actionable signals. Performance metrics like profit factor and number of winners are displayed on the chart to determine potential results.
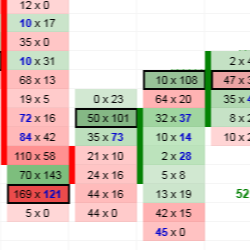
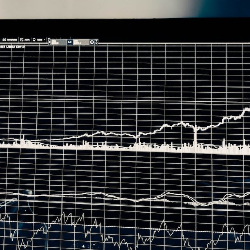
Market Analyzer Column: Effortlessly tailor real-time market data to your needs.
Prove you have what it takes to make money and we may fund you as a trader! We did it ourselves, we’ve done it for others, and we know we can help you, too. Learn. Get Funded. Trade! Come take the TradeDay Evaluation Challenge and get funded as a trader with our capital in live markets.
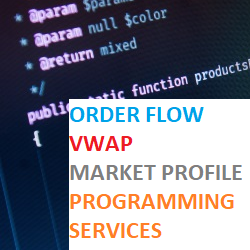
We offer programming services for users of NinjaTrader. Our expert IT professionals will be glad to work on your most ambitious projects. We specialize in programming strategies based on Order Flow, Market Profile and VWAP to automate trading as a mechanical system.
December 2, 2024
Mastering Sideways Markets With Auction Bars and Range Projections
November 19, 2024
Enhancing Your Automated Trading System: Key Insights from Best Pro Trade
November 14, 2024
NinjaTrader New Ecosystem Tools: October 2024 Edition
Enter Email for Updates