Innovation in Momentum: SPEARHEAD is a cutting-edge indicator for traders and investors. It compares the momentum of two instruments, with one being a custom synthetic instrument created by the user, incorporating up to seven assets like stocks, commodities, currencies, etc. Also in Spanish.
BookMap helps traders detect better support and resistance levels by plotting order book data directly on the chart. Through market depth behind price bars, order flow traders can watch the limit order book unfold in real time, highlighting significant price levels such as support and resistance.
Denotes fitness functions in the NinjaTrader 8 platform, evaluating trading strategies' performance. By leveraging specific parameters, they assist traders in analyzing, comparing and selecting the most effective trading methodologies.
Turn your ideas into code! We work 1-on-1 with you to understand your needs and engineer a quality software solution that meets them. Automated strategies, indicators, data analytics, portfolio supervision – let us know your needs, we’re here to make it happen. Get in touch with us today!
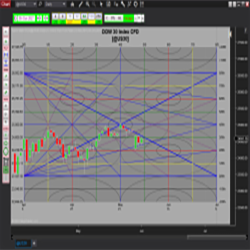
Samri Math Price-in-Time is a comprehensive tool for traders using Murrey Math methodology. This indicator calculates not just PRICE levels, but also sets the price in TIME. Easily switch between time frames (day or minute only) with the user-friendly interface.
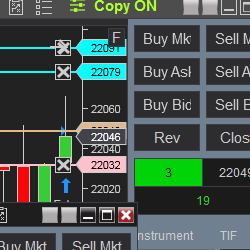
EOB or End Of Bar is an amazing close-bar order tool that is nowhere else to be found. This amazing add-on works with any bar types. Let EOB Ordering play the tough game for you, as it was designed to reduce the ordering time to just a few milliseconds.
By subscribing to our Indicator Spotlight traders get a free monthly download from the LizardIndicators indicator library. All indicator features are documented with an explanation on how the indicator can be used in a trading strategy. Sign up today!
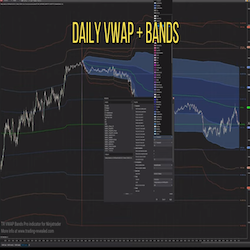
The VWAP Bands Pro indicator for NinjaTrader 8 is a must-have for traders who want to see the market map in real time along with precise support/resistance levels used by the big firms algorithm.
Live trading room for ES S&P 500 day traders. Based on Rose’s Fibonacci trading system, charts are posted and price action shared. Previous trades are reviewed so that students can improve. Discord chat room goals: help students become independent traders & provide a supportive community.
Replicate orders from a master account/master instrument to one or more slave accounts/slave instruments. The Replicator was designed for Micro E-mini trading and managing multiple accounts with a single instance of NinjaTrader 8.
December 2, 2024
Mastering Sideways Markets With Auction Bars and Range Projections
November 19, 2024
Enhancing Your Automated Trading System: Key Insights from Best Pro Trade
November 14, 2024
NinjaTrader New Ecosystem Tools: October 2024 Edition
Enter Email for Updates