The TrendLord indicator is a chart overlay indicator that can be used as a confirmation indicator. It is a derivative of a smoothed moving average but with the advantage of representing it as a colored change histogram. Click to learn more.
Wizdough offers custom programming including custom indicators, strategies, backtesting and alerting. Contact us to get a free consultation.
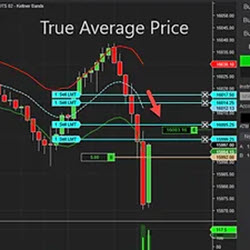
Discover accuracy with the True Average Price Indicator. Move beyond FIFO methods and accurately track your average price on NinjaTrader. This tool provides real-time insights into your position's average cost, enabling smarter trading decisions. Elevate your strategy with informed precision.
Entry Signals from TREMPER.com generates entries based on proprietary internal conditions. It allows you to manage your position based on chart size and your parameters.
Custom Development Services are tailored for NinjaTrader users, offering bespoke solutions across markets. They provide real-time cryptocurrency data integration, custom indicators, strategies, and add-ons to optimize trading performance and profitability.
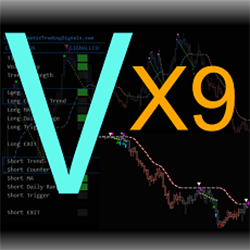
High performance, fully-automated night and day trading for NQ and MNQ. The VX9 wakes up before sunrise and finds the best trading opportunities in the morning twilight. Built from scratch to be a true day trading system, the VX9 offers simplicity and performance.
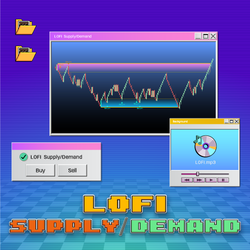
LOFI Supply/Demand goes beyond zone identification, delivering trading signals. It offers three distinctive signals within each zone: Pullback, Return, and Break signals. The indicator's well-defined rules ensure only the highest-opportunity signals are revealed, maintaining a clear chart.
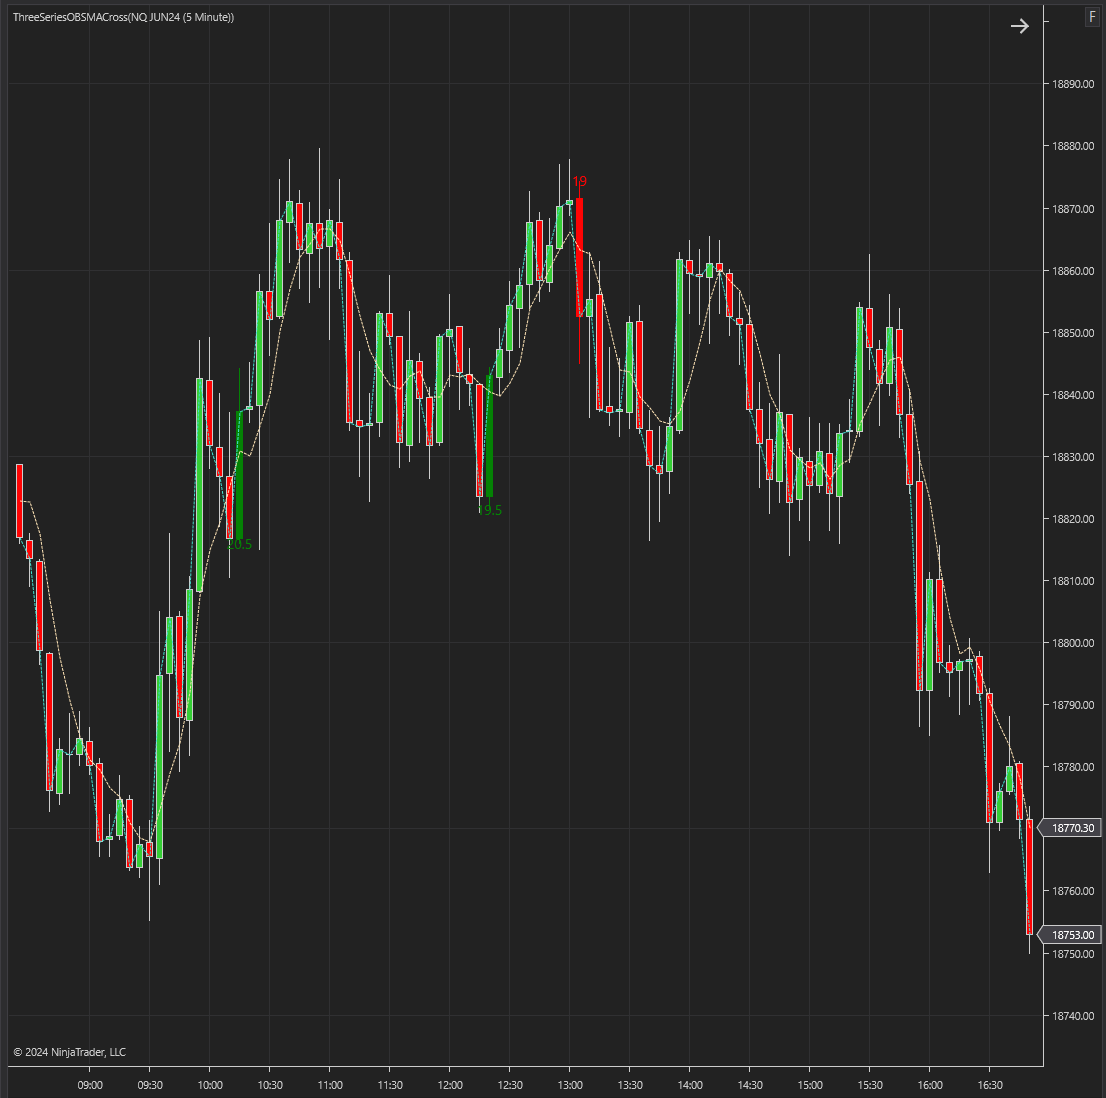
This Indicator is a sophisticated tool designed to help traders identify and capitalize on bullish and bearish market trends. By combining Simple Moving Averages (SMA) and engulfing pattern detection, this indicator provides clear and actionable signals for entering and exiting trades.
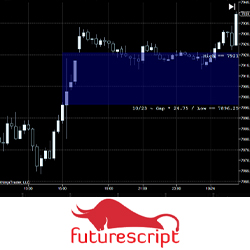
The Gap indicator was designed to illustrate when dramatic price disconnects from one period to the next when the market establishes critical levels. This indicator has been carefully constructed to explore different perspectives and trading approaches related to the gap in intuitive ways.
ZoneVue Pro, an advanced Supply & Demand Indicator, giving you the edge you've been looking for! Identify quality zones from price action to order flow, identifying pending orders from banks and intuitions. No lagging indicators. Trade like a sniper. Transform your trading!
December 2, 2024
Mastering Sideways Markets With Auction Bars and Range Projections
November 19, 2024
Enhancing Your Automated Trading System: Key Insights from Best Pro Trade
November 14, 2024
NinjaTrader New Ecosystem Tools: October 2024 Edition
Enter Email for Updates