Nordman Algorithms provides indicator and strategy programming services. Indicators for trend identification, trade zone detection, news impact calculation, price pattern visualization & more can be built, as well as extendable, maintainable systems that follow your trade strategy.
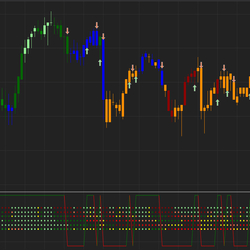
Suite of four complementary indicators provides entry and exit alerts while offering valuable price momentum insights. These indicators can be integrated with your preferred setups and present price momentum in a visually engaging, color-coded format.
With no coding required, StratGen allows the everyday trader to generate strategies. In a couple of clicks, traders can generate strategies with over +1,000 signals at their fingertips. Generate strategies using indicators, price action, time of day, alternate exits and much more.
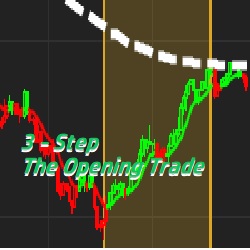
The 3 Step Indicator and Workspace package from The Opening Trade combines three basic elements into a simple Red vs Green color coded, Mean Reversion Discretionary System. Price Action, Trend Strength and Supply and Demand are what drive this 3 Step System.
Convert indicators, strategies and algorithms from any platform to NinjaTrader 7 or NinjaTrader 8! Contact Patternsmart for a quote today!
The Min Pack is a starter package featuring IndicatorSmart’s most popular, important and advanced trading tools. This minimum powerhouse tool kit has the most basic, minimum components that show you the minimum of what you cannot see just by looking at an ordinary chart.
The ribbon-like indicator, Fantastic MA Ribbon, is created by plotting multiple moving averages (MA) with varying lengths. It incorporates four signal mechanisms, offering diverse options to align with your unique trading style.
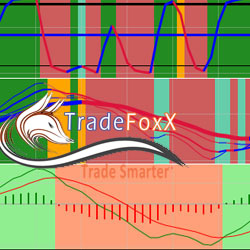
We know how it feels to have your emotions overcome your logic the moment you enter a trade. That's why we, with 15 years in software automation and day trading, created a powerful bot for ourselves... and for you! Package includes 13 custom indicators and strategies. Download your free trial today!
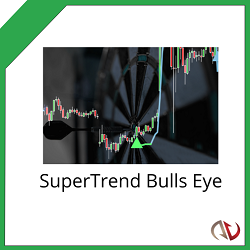
The world’s first self-optimizing SuperTrend indicator. It uses spearhead third-generation scanning to identify actionable signals. Performance metrics like profit factor and number of winners are displayed on the chart to determine potential results.
The TrendLord indicator is a chart overlay indicator that can be used as a confirmation indicator. It is a derivative of a smoothed moving average but with the advantage of representing it as a colored change histogram. Click to learn more.
December 2, 2024
Mastering Sideways Markets With Auction Bars and Range Projections
November 19, 2024
Enhancing Your Automated Trading System: Key Insights from Best Pro Trade
November 14, 2024
NinjaTrader New Ecosystem Tools: October 2024 Edition
Enter Email for Updates