If time is important, the Nison Candle Scanner (NCS) experts can install and customize NCS software for traders. NCS White Glove Service is a fast and easy process to remotely configure NCS on any trading computer anywhere in the world. Register now to save time and focus on trading.
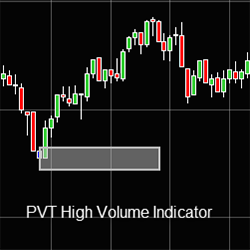
Precision Volume Trading High Volume Indicator lets you know where the volume is being traded to trade with high liquidity.
The Zerolag HATEMA is based on a TEMA that uses Heikin-Ashi candles as input series. This indicator does not depend on the selected input series, as it uses open, high, low and close of each candle.
The market is either trending or ranging. This indicator from Tyche Trading gives you the power to know exactly when it is ranging with a high level of precision. Their Auto-Trading Range Indicator makes it easy to know what price to enter and exit your trades at. Get a seven-day free trial today!
The system features two parallel cloud bands that enhance trend analysis. It provides two types of pullback signals: Fibonacci and price action, to expand trading opportunities. Additionally, the trailing stop plot, driven by price action, ensures timely exits during sudden market fluctuations.
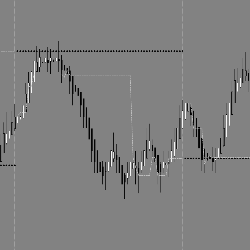
EPyFVPOC is an indicator which displays in real-time the most traded price of the current day, as well as for any previous days loaded in your chart. It also indicates the Point of Control for the previous session, an important level for intraday traders.
KaseX is a symbol based technical analysis trading study with a simple, uncluttered display. KaseX captures dozens of complex technical signals in multiple time-frames. Variable optimization is unnecessary as pre-configured sensitivity settings are built in. Take a free 30-day trial today!
Die TrendTechnik® ist ein neuer eigenständiger und in sich geschlossener Fachbereich. Mit trendtechnischen Methoden werden Tradern sowie Analysten besondere Situationen sichtbar und nutzbar, die vielen Anderen verborgen bleiben. Erfahre mehr und nutze die deutlich besseren Möglichkeiten und Chancen.
The Buy/Sell Zones are an adaptive approach to expansion and contraction within market rotations. Each rotation provides an area of interest for either the bid or offer, where they need to engage in order to protect the possibility of further extension. This approach allows you to trade with trend.
This comprehensive program begins with the Basics of Trading, where you'll learn fundamental concepts, market structures, and essential terminologies. Progressing to the Intermediate Strategies module, you'll dive into technical analysis, risk management, and trading psychology.
December 2, 2024
Mastering Sideways Markets With Auction Bars and Range Projections
November 19, 2024
Enhancing Your Automated Trading System: Key Insights from Best Pro Trade
November 14, 2024
NinjaTrader New Ecosystem Tools: October 2024 Edition
Enter Email for Updates