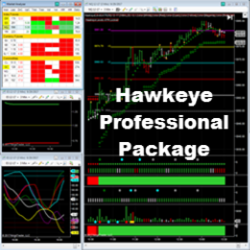
The Hawkeye Professional Package includes all Hawkeye tools for volume spread analysis, on multiple time-frames across all markets. These powerful indicators tell traders when a trend is commencing, in congestion and where to find the correct exit. Buy Now using code: “NT10Off” for a 10% discount.
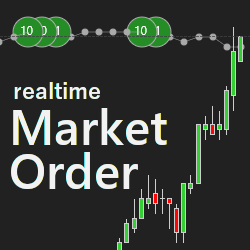
Dynamically see real-time market orders of buyers and sellers in the normal candlestick chart. Get a better feel for the market and its dynamics at the important price zones. Get started today with a two-week free trial!
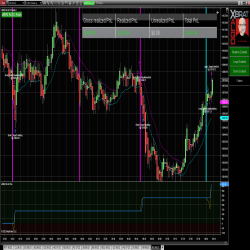
xBrad Auto Trader is an automated trading algorithm for futures trading across all sectors! Indexes, energy, metals and bonds. Each instrument has been taken through a machine learning architect software and can be optimized on your trading platform for the subscribed auto trader!
The Lighthouse Trading strategy works fully automatically in the futures market. Besides trading in different markets simultaneously, you can configure it in distinct ways in each one of them. The algorithm analyses time and sales, volume, rhythm and acceleration in real time.
Find out how you can identify accumulation and distribution with price action trading. Spot the footprints left by “smart money” with price and volume, the Wyckoff method way, when day trading or swing trading the stocks and futures. Join today and be part of the lifetime community group.
PureMO & ScalpMO: The ultimate combo for momentum and scalping mastery. Track momentum, dominate scalping. Two cutting-edge tools in one package, built to transform your trading. Try it free for 7 days and see the difference!
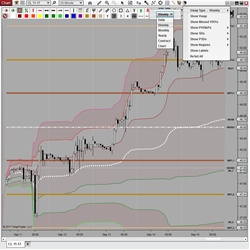
VWAP Plus features 7 configurable Session Types (Daily, Weekly, Monthly, Contract, etc.) and 3 user defined upper and lower standard deviations. It displays 17 Unique Current & Previous Levels, includes a toolbar icon for easy setup, and is Market Analyzer, Strategy Builder & Bloodhound ready!
Quickly save and load sets of parameters in NinjaTrader. If you are tired of changing indicator and strategy parameters multiple times, SaveAndLoad adds a new system-wide feature for saving and loading any number of parameter sets, for indicators, for strategies, and for the Strategy Analyzer!
The Volatility Bands indicator attempts to present a way to measure and visualize volatility, using standard deviations (σ) and average true range indicator, and aims to point out areas that might indicate potential trading opportunities. Click to learn more.
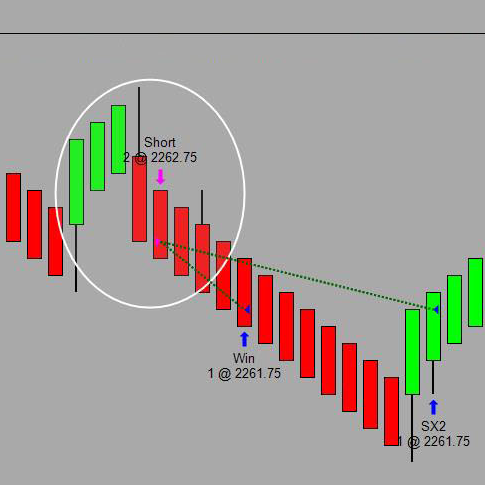
Recently updated, the Conway Market DNA Day Trading System now includes Auto Strategy Trade Entry and Exit and a simplified Order Flow which projects 1 bar into the future. Also included is our Chop Filter Indicator, which will not take trades in a choppy market, and a 236-page product manual.
December 2, 2024
Mastering Sideways Markets With Auction Bars and Range Projections
November 19, 2024
Enhancing Your Automated Trading System: Key Insights from Best Pro Trade
November 14, 2024
NinjaTrader New Ecosystem Tools: October 2024 Edition
Enter Email for Updates