Advanced Indicators are some of the most advanced indicators currently available on the market! Get cutting-edge trading tools - encompassing years of experience in financial market research, engineering, mathematics, a.i., and data science. These unique pro tools not available anywhere else!
Precision Index Oscillator (Pi-Osc) can provide trade timing signals and is a consensus indicator with some powerful variances to industry standard oscillators. At first glance, it would appear like any other oscillator, but when viewing it in tandem with other indicators the differences are clear.
The Tradesight Live Trading Lab is a Discord channel that allows anyone to listen to live market commentary, view charts shared by Tradesight analysts, and ask questions throughout the trading day. It is a free service and available to anyone who downloads the Discord app on PC, Mac, web, or mobile.
The TradeOMeter is a collection of proprietary indicators developed specifically for day traders. When these real-time signals are used together, they create a powerful timing tool for day trading the index futures (ES, NQ, YM, RTY, CL, and GC). Vocal and visual alerts show you the trade zones.
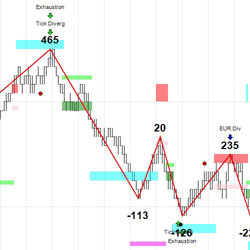
ZoneTraderPro features unique support and resistance zones to match known market trading patterns along with intuitive real time tools to identify trade entries and exits. Nothing ever disappears from a ZoneTraderPro chart so you can create and test trading strategies.
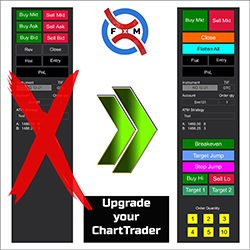
Upgrade your ChartTrader. Extend the capabilities of NinjaTrader's ChartTrader with added functionality: a Breakeven button, two Target buttons, a Stop Jump and a Target Jump button. Also includes a Buy High and Sell Low button and a Quantity Grid to easily change the number of contracts you trade.
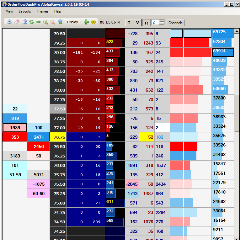
AlphaReveal is an advanced tape reading and order flow software that illuminates both the order book and the order flow on the NinjaTrader SuperDOM for real-time decision making.
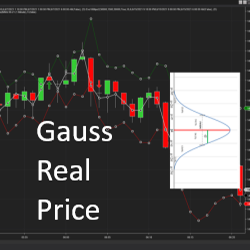
QuantWise analysts were looking for a way to determine the real price or the “point of interest” inside a bar. The idea behind the Gauss Real Price indicator is to use the concepts of how price is formed and how agents make their movements to defend their positions.
The Lighthouse Trading strategy works fully automatically in the futures market. Besides trading in different markets simultaneously, you can configure it in distinct ways in each one of them. The algorithm analyses time and sales, volume, rhythm and acceleration in real time.
ATS QQE is a powerful Quantitative Qualitative Estimation (QQE) indicator with additional options which make it more versatile.
March 25, 2024
Trading Pullbacks and Reversals: Simplifying a Once Complex Retail Trading Strategy
March 21, 2024
VWAP Indicator: Average Price Shown Based on Price, Volume
March 18, 2024
Trade Copier Strategies: Make Efficiency Work for You When Futures Trading
Enter Email for Updates