Trendlines can be drawn in so many incorrect ways. Drawing it incorrectly can make most trades losers and vice versa. Getting it right makes all the difference! QTL has a faster and far more accurate approach. Ready to automatically find the most accurate trendlines?
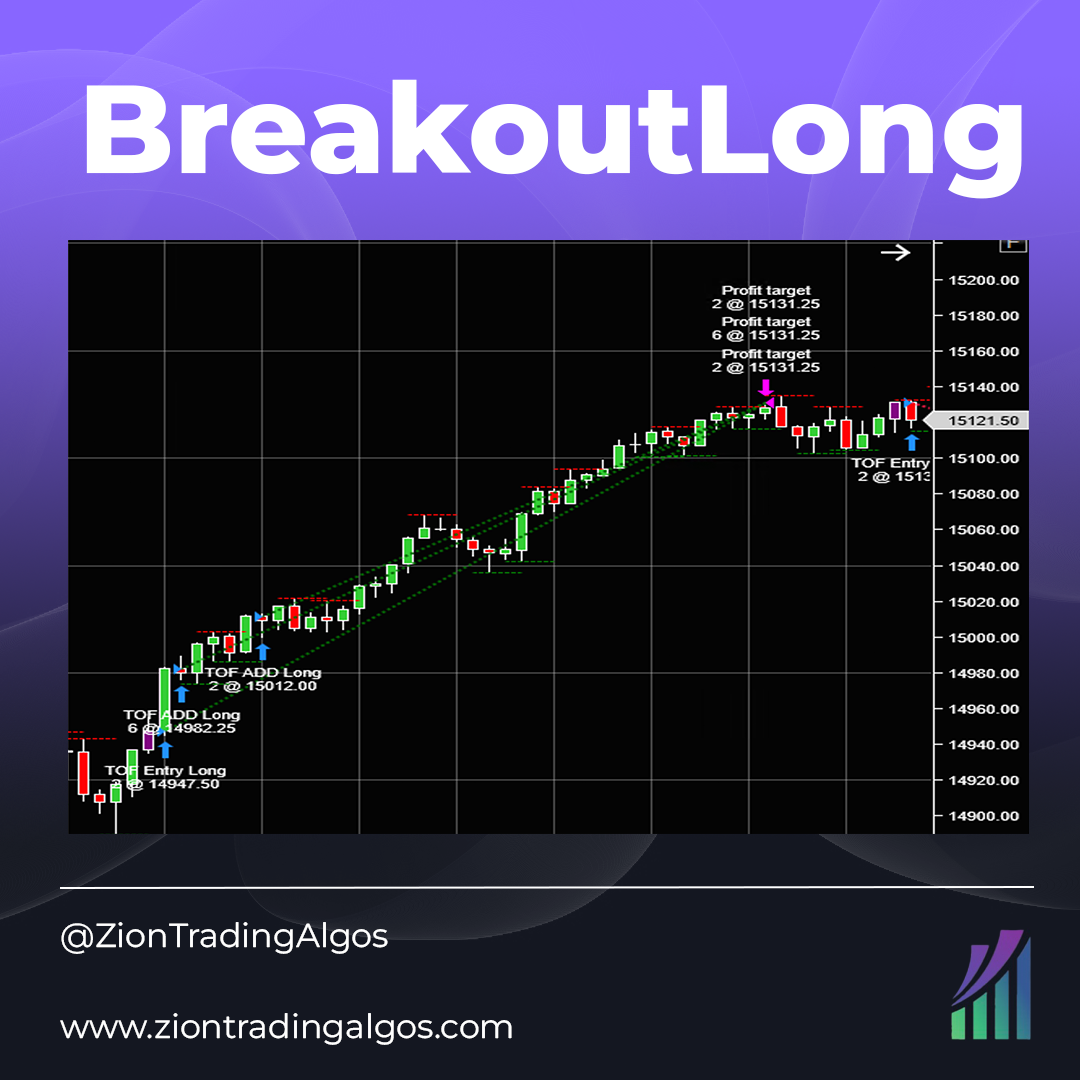
BreakoutLong is an intraday breakout system that trades on the 30-minute chart. It uses an EMA and looks for a specific price pattern-based breakout. It has volatility derived stop loss and take profit targets and only has a single entry and exit system. Tested on MES, MNQ and MYM.
DrawCator VWAP is a feature-rich drawing tool which plots VWAP (+SD Bands) by mouse drag-n-draw on custom start & end points. New Attach and Roll modes provide auto updating and forwarding with live markets. Alerts, Ninjascripting, Strategy & Market Analyzer and 1-Click draw are all supported.
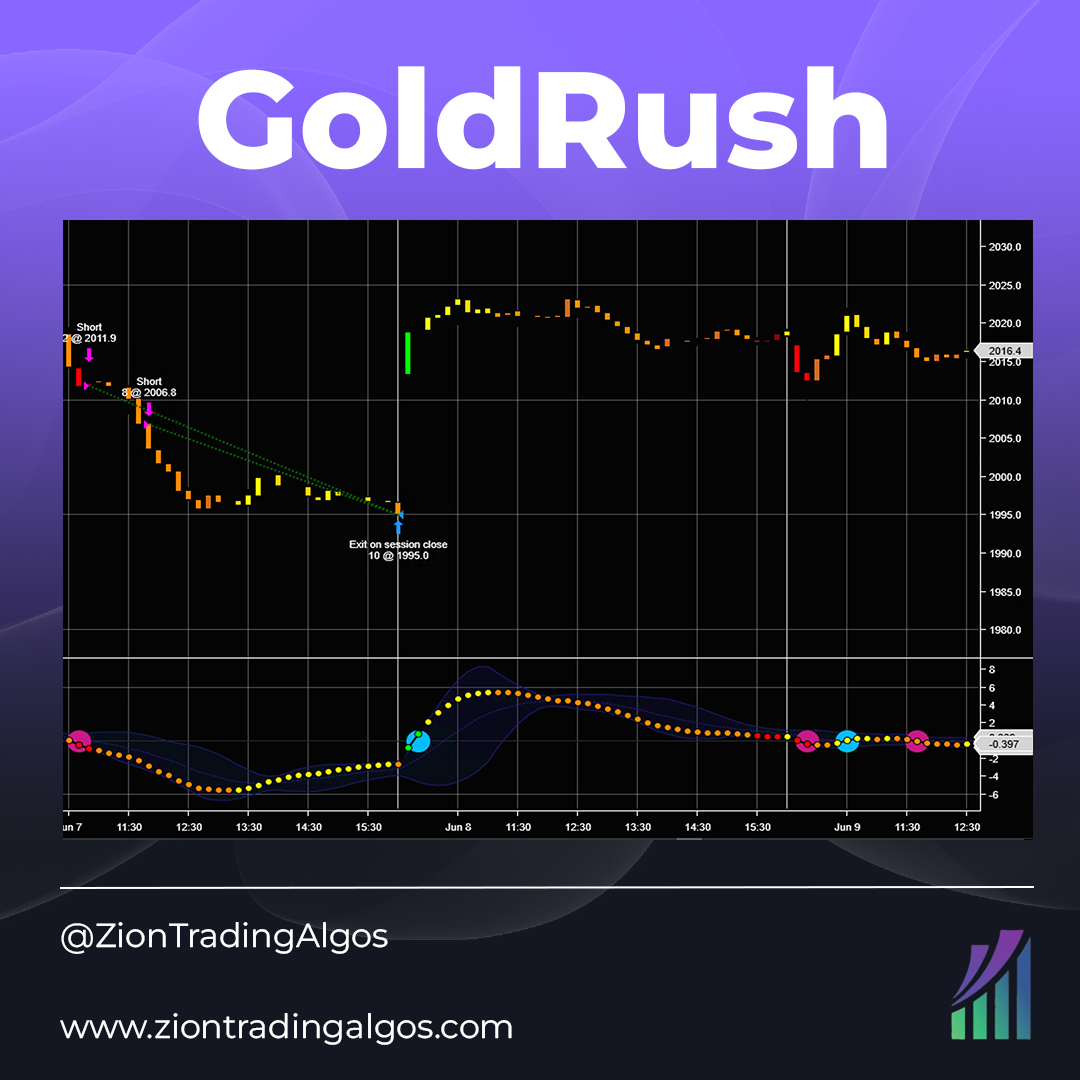
GoldRush is an intraday strategy on the 10-minute chart. Designed to take an initial amount of GC contracts, it uses a few custom indicators that will also be included with purchase.
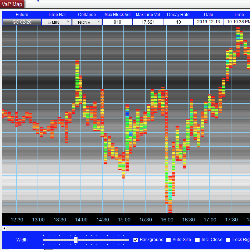
Visualize the market like never before. The VAPMap (Volume At Price Map) displays the total volume traded at each price and time, using a color spectrum from red (lowest) to blue (highest). The background lines show the total historical traded volume for every price level. Click for a free trial.
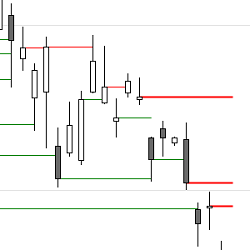
On instruments with regular trading hours you often see gaps on a chart which stay open for more than a day. A couple of times a month these open gaps from prior days also play an obvious role as support or resistance on the intraday chart. These tools are free to download and use!
In this course you will learn how to code add-ons for NinjaTrader 8. It consists of over 10 lectures on how to create custom windows, pass data from strategies into add-ons, create beautiful charts using 3rd party libraries and use statistics to find new ideas for building systems.
Try our fully-functional, ready-to-use automated trading strategy for NinjaTrader 8 at no cost for 14 days. Designed for the futures market, it has been thoroughly backtested, needs no adjustments, & is suitable for Micro/Mini markets. Full support and templates are included during your free trial.
Use Statistics to determine intraday High Probability Targets and place stops outside of the regular market noise. This includes Stats on Initial Balance, Mid, Session & Extension ranges, as well as 1-minute rotations & many more! Available for ES, NQ, FDAX & FESX. Download your free report now!
E-Mini Tutor offers three 1 on 1 Day Trading Education options aimed at traders who are interested in understanding the markets. The Pivot based trading methodologies strive to forecast market moves before they occur empowering traders to work smart, not hard. Enroll today!
December 2, 2024
Mastering Sideways Markets With Auction Bars and Range Projections
November 19, 2024
Enhancing Your Automated Trading System: Key Insights from Best Pro Trade
November 14, 2024
NinjaTrader New Ecosystem Tools: October 2024 Edition
Enter Email for Updates