This is a UNIVERSAL solution to regular divergence trading. Divergences can be identified by comparing price action and an oscillator of your choice. Yes, you can freely use this NinjaTrader divergence indicator with RSI or MACD, stochastic, CCI, and other indicators, from any vendors!
This custom tool is a buy sell short indicator that works in real time using price action, stats and probabilities. It has been used for many years by My Private Trader clients. It is very easy to use and provides high-probability signals.
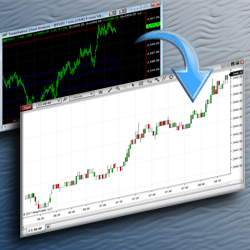
Moore Tech, LLC has over 15 years of experience working with TradeStation, and have converted hundreds of indicators and strategies to be compatible with NinjaTrader. Contact them today to receive a free estimate for having your code converted from EasyLanguage to NinjaScript.
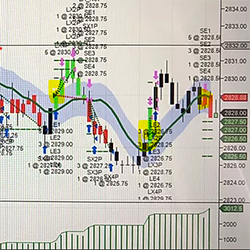
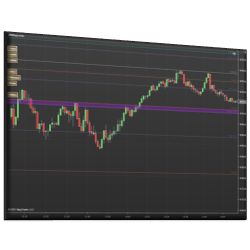
By automatically drawing significant price levels, such as ADR (Average Daily Range) min and max values, yesterday’s OHLC, pivot points (S1, S2, S3 and R1, R2, R3), and weekly OHLC levels, this indicator offers valuable insights to help you make more informed trading decisions.
Enhance your trading with our point and click Anchored VWAP indicator for NinjaTrader 8. Built as an indicator, not a drawing tool. Features unique point-and-click anchor setting with hotkeys, 3 customizable deviation bands, and 8 VWAP calculation methods. Start your free trial today!
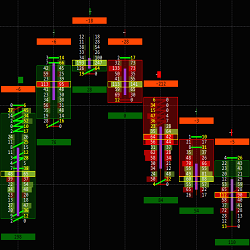
The Key Levels Confluence Indicator calculates various daily levels and combines them into powerful zones where price action is likely to respond in the future. Daily levels include the Open, High, Low and Close (OHLC) of past days, Fibonacci Levels, Whole Numbers, Current Day Levels and Pivots.
This fully-automated trading strategy from Indicatortrader works on both NinjaTrader 7 & 8. It can operate 24 hours a day can be implemented in equity, futures and forex markets. Use this strategy to backtest years of historical data to find the best possible trading hours.
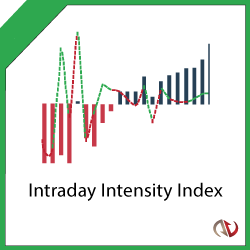
This awesome indicator allows traders to spot institutional block trades (buy and sell). It provides confirmation for impeding trend reversals and avoids premature or false reversal signals. Intraday Intensity Index is recommended by John Bollinger to supplement the Bollinger Bands™ indicator.
The Advanced Trading Couse focuses on teaching traders how to use order flow based tools for trading the futures, forex and equities markets.
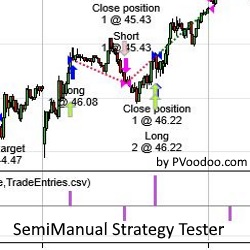
Do you have an idea which you would like to test without actually writing the strategy code to get the trading results? A simple way to do that is by using the PVAddManualTrades and PVUseManualTrades strategies, both utilizing statistics and options from the Strategy Analyzer. Try them free!
December 2, 2024
Mastering Sideways Markets With Auction Bars and Range Projections
November 19, 2024
Enhancing Your Automated Trading System: Key Insights from Best Pro Trade
November 14, 2024
NinjaTrader New Ecosystem Tools: October 2024 Edition
Enter Email for Updates