Innovative Trading Solutions has been building indicators, fully-automated or ATM Strategies, chart types, and chart styles to client specifications for over 8 years. They also offer NinjaTrader 7 to NinjaTrader 8 conversion services. Get a free quote for your project today!
The market is either trending or ranging. This indicator from Tyche Trading gives you the power to know exactly when it is ranging with a high level of precision. Their Auto-Trading Range Indicator makes it easy to know what price to enter and exit your trades at. Get a seven-day free trial today!
New "Ultimate A.I." indicator has it all: buy and sell signals, trend reversal signals, scalping signals, pullback alerts and stop loss placement lines. It’s multiple systems all in one. Learn more! Watch a demo tutorial by clicking the link! We also have a private chat group. Get a 5 day trial!
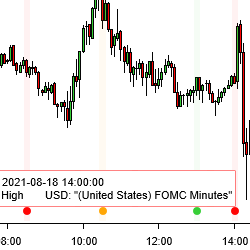
Improve planning of your trades by seeing when economic calendar news gets released – right on your NinjaTrader 8 charts. Option to select either Forex Factory or Myfxbook as news source. You can see news for the current week and historical news releases. You can also filter by news impact and more!
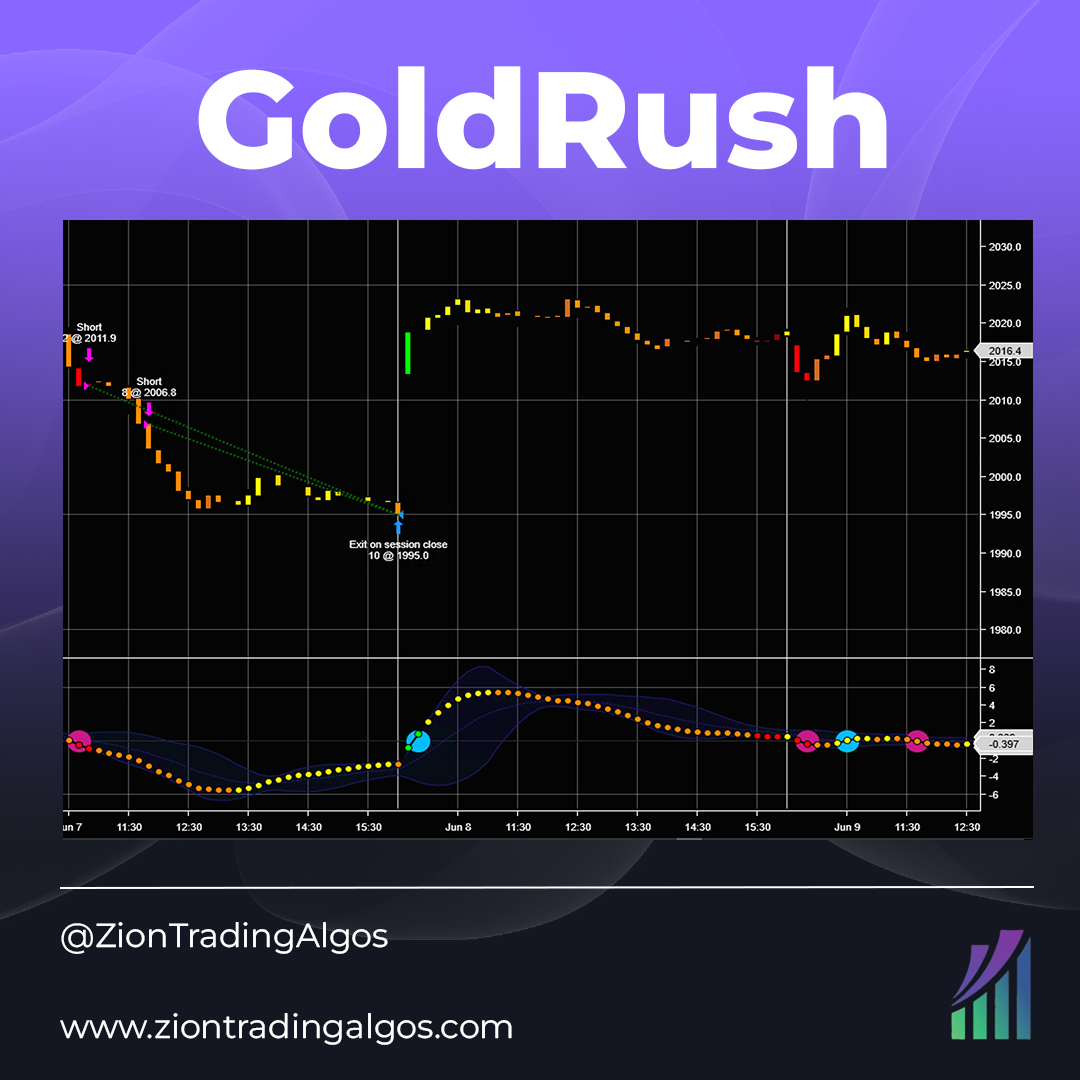
GoldRush is an intraday strategy on the 10-minute chart. Designed to take an initial amount of GC contracts, it uses a few custom indicators that will also be included with purchase.
To receive their free Weekly Market Movers trading schedule, just enter your email in the "" Get Free Training Video "" box. See how they schedule their trades each week as they will email you their free weekly trading schedule.
This free package includes Symbol Watermark, which shows the name of the symbol and time frame directly on the chart; Trader Limit, which limits trading when the daily loss level is reached; SR Dynamic Lines (dynamic resistance zones); and many other useful tools. These products are free for life.
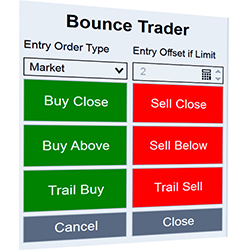
Get fast and accurate fills with Bounce Trader. Trade directly from your charts. Easily trigger orders on bar close, bar reverse or open OCO orders depending on how bar closes. Select between market or limit orders. With Bounce Trader and Simple EMA’s, it is easy to spot where price bounces from.
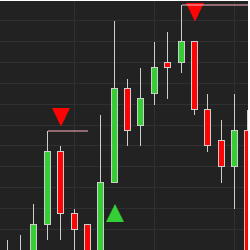
Download a 14-day test period of this trading indicator that identifies points to enter the market for price pullbacks and reversals. The indicator uses pure price action, which makes it possible to get rid of lagging indicators. Be independent of the values and stage of the market.
Master quantitative trading with our courses. From back-testing basics to advanced strategy development, learn to build systematic trading systems. Explore futures, pairs trading, & essential Python programming tailored for financial markets. Gain a trading edge with real-world examples. Enroll now!
December 2, 2024
Mastering Sideways Markets With Auction Bars and Range Projections
November 19, 2024
Enhancing Your Automated Trading System: Key Insights from Best Pro Trade
November 14, 2024
NinjaTrader New Ecosystem Tools: October 2024 Edition
Enter Email for Updates