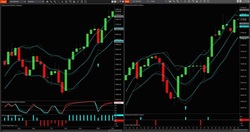
The IABands are envelopes similar in concept to the popular Bollinger Bands, only far more responsive. The direction and the width of the IABands gives an idea of when a financial instrument is trending versus not trending. The value of any band will very often turn out to be a strong reversal area.
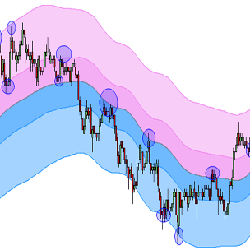
A remarkable price channel, with a proprietary formula that is adaptive to market conditions and reveals dynamic support and resistance levels. TC_NovelChannel paints two colored bands which show a consistent tendency to provide support and resistance to price, for any instrument or time-frame.
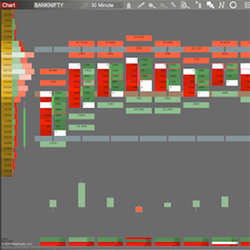
The Bell Order Flow-PRO is a toolkit of optimized order flow and volume visualization. It offers some of the unique features like BidxAsk Ladders, High Volume Alert, Volume Imbalance, Volume Spread Analysis, Delta Candles, Volume Profile, COT, Contract Reversal and customizable chart colors.
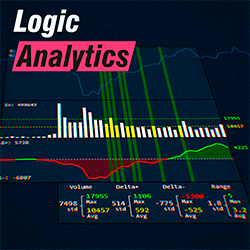
Visualize the relationship between delta and volume with accurate statistical calculations on delta, ask, bid, and volume. This tool combines the power of data analysis with advanced charting, allowing you to see the most relevant market movements.
Gain an understanding of trading: market analysis, technical analysis, fundamental analysis, indicator trading, day trading/scalping, strategies, trading psychology, expectation and mindset, money management and risk management. Practice on a demo account. Referring trading brokerage/platform.
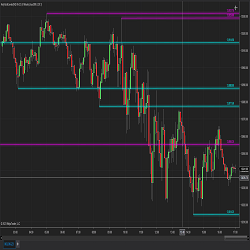
This algorithm calculates the support and resistance based on a look back period (number) of candles or bars and determines the support and resistance levels dynamically.
In the rapidly evolving landscape of the stock market, traditional trading strategies and indicators often fall short in the face of complex and volatile market conditions. This is where Artificial Intelligence (AI) steps in, revolutionizing the way investors approach trading.
The B.I.T.S (Breakout Intelligent Trading Signals) Indicator is designed around exclusive machine learning breakout technology for both swing trading and day trading stocks and futures on multiple timeframes.
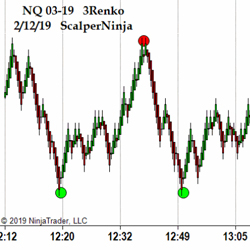
Scalper Pivot Point indicates reversals in real-time and on the FIRST TICK of the bar. If you understand the basics of how to read price action and are looking for an additional signal for entries and exits, then Scalper Pivot Point software is for you!
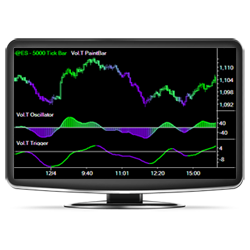
The Vol.T™ indicator package diagnoses volume-trend and tick-pressure to provide trading signals based on buying or selling pressure (rather than just movements in price). Come see how the Vol.T™ Indicators utilize volume and tick data more effectively than ever before!
December 2, 2024
Mastering Sideways Markets With Auction Bars and Range Projections
November 19, 2024
Enhancing Your Automated Trading System: Key Insights from Best Pro Trade
November 14, 2024
NinjaTrader New Ecosystem Tools: October 2024 Edition
Enter Email for Updates