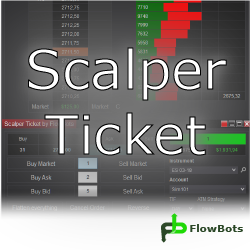
Scalper Ticket was made to facilitate and improve the performance of scalping operations by gaining speed in quantity changes at the bid/ask levels. It shows the first book line, position average price and the PnL with commissions cost. A perfect match to use in conjunction with the SuperDOM.
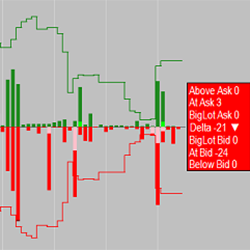
Use the Tape? Time & Sales can be hard to follow; however, this indicator boils it down to an easy to read histogram. Easily see the bid & ask trades, above ask & below bid trades, BigLot trades, the delta bid/ask ratio and much more. Learn more about the BigLotHistogram indicator now!
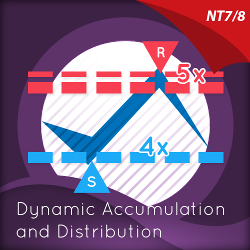
Dynamic Accumulation & Distribution plots graphically and numerically, how many times a price region has been tested. Levels tested more will appear as deeper lines, and levels tested less will appear as narrower lines, instantly revealing the depth of any accumulation or distribution region.
Try our fully-functional, ready-to-use automated trading strategy for NinjaTrader 8 at no cost for 14 days. Designed for the futures market, it has been thoroughly backtested, needs no adjustments, & is suitable for Micro/Mini markets. Full support and templates are included during your free trial.
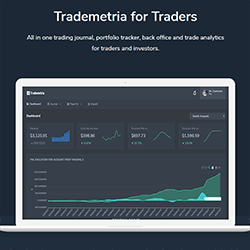
This all-in-one trading journal, portfolio tracker and trade analyzer software helps traders and investors make better trading decisions based on statistical evidence. Better trading starts with better data.
ABC Trader is for the more advanced and discretionary trader looking for consistency. This easy-to-read indicator helps to identify trades. It includes a predesigned workspace, ready-to-use ABC Rules, and advises what to expect from the markets.
Custom program your own indicators / strategies / add-ons / tools for NT8. We custom program fully or semi-automated strategies, indicators, add-ons and tools based on your requirements. All source code delivered with additional free tech support after delivery. Get a free, no-obligation quote now!
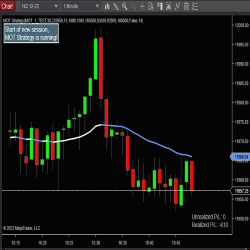
MightyOxTrading Strategy is an automated trading strategy for NinjaTrader 8. It has the option to use higher-timeframe bars as a filter for potential trades. It uses an ATM strategy for order management, so you can configure it for a single contract or for multiple contracts using a "runner".
L’orderflow trading è lo studio dei volumi nel tempo e nello spazio sia nel book che nel volume profile. Individuare le zone di prezzo con maggior volume di scambio sul book e nel tempo. Studiare la dinamicità dei volumi sul book. Come usare il WVAP. Come usare il Cumulative Delta.
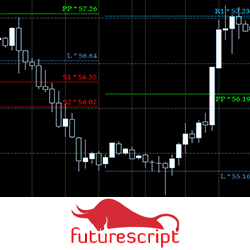
The Pivot is based on the classic pivot point indicator with a few twists and innovations. These levels present a very straightforward approach to buying and selling critical points as the session plays out using good risk/reward disciplines.
December 2, 2024
Mastering Sideways Markets With Auction Bars and Range Projections
November 19, 2024
Enhancing Your Automated Trading System: Key Insights from Best Pro Trade
November 14, 2024
NinjaTrader New Ecosystem Tools: October 2024 Edition
Enter Email for Updates